What are Python Libraries?
Python libraries are collections of pre-written code that provide a wide range of functionalities to simplify development tasks in Python programming. These libraries contain modules and functions that allow users to perform various operations without having to write code from scratch. Python libraries cover diverse areas such as data analysis, machine learning, web development, scientific computing, and more, making Python a versatile and powerful language for different applications. Some popular Python libraries include NumPy, pandas, Matplotlib, scikit-learn, TensorFlow, and BeautifulSoup.
Benefits Of Using Python For Data Science
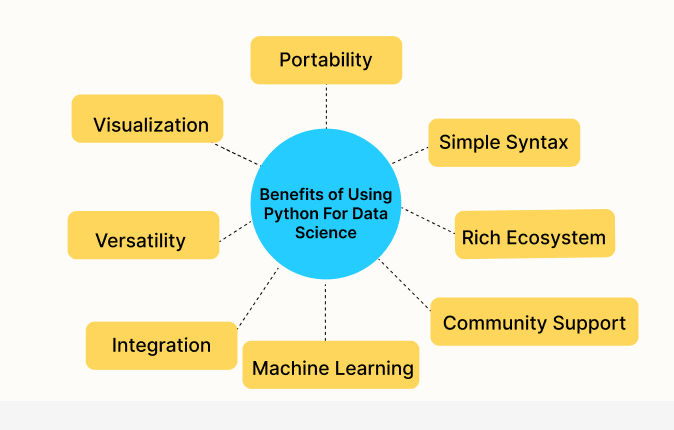
Using Python for data science offers several advantages because it's easy to learn and use. Here are some benefits:
Simple Syntax: Python has straightforward syntax, making it easier for beginners to understand and write code.
Rich Ecosystem: Python has a vast ecosystem of libraries like pandas, NumPy, and scikit-learn, which simplify complex data analysis tasks.
Community Support: Python has a large and active community of developers who contribute to libraries, offer support, and share resources, making it easier to find solutions to problems.
Versatility: Python is versatile and can be used for various tasks beyond data science, such as web development, automation, and scripting.
Integration: Python integrates well with other languages and tools, allowing data scientists to combine Python with technologies like SQL databases, Hadoop, and Spark for efficient data processing.
Visualization: Python offers powerful visualization libraries like Matplotlib and Seaborn, enabling data scientists to create insightful plots and charts to communicate their findings effectively.
Machine Learning: Python is widely used in the field of machine learning, with libraries like TensorFlow and PyTorch providing robust frameworks for building and deploying machine learning models.
Python Libraries for Data Science
NumPy

NumPy, which stands for Numerical Python, is a library in Python that makes it easier to work with large arrays and matrices of numerical data. It's like a powerful calculator that can handle lots and lots of numbers at once. NumPy is especially useful because it lets you perform complex mathematical operations on whole collections of numbers without needing to write loops in Python. This not only makes your code cleaner and easier to understand but also significantly speeds up the processing time since NumPy operations are often implemented in a more efficient manner using lower-level languages like C.
For example, if you wanted to add, multiply, or even perform more complex operations on lists of numbers, NumPy provides tools that let you do this very quickly and with simple commands. This makes it a fundamental tool for anyone doing data science, where manipulating and analyzing large datasets is common.
Pandas

Pandas is a library in Python designed to make working with "relational" or "labeled" data both easy and intuitive. It aims to be the fundamental high-level building block for doing practical, real-world data analysis in Python. Think of it as a powerful tool that has been specifically crafted to help you deal with the messy details of data manipulation and analysis.
Imagine you have a table of data, much like an Excel spreadsheet. Pandas makes it easy to load, process, and analyze such data using its main data structure called the DataFrame. A DataFrame is basically a table where data is neatly aligned in rows and columns. You can easily read data from multiple sources like files, databases, and web APIs; perform complex operations like merging, reshaping, selecting, as well as cleaning; and finally, analyze it using functions that allow for summarization, grouping, and complex aggregations.
Pandas is particularly well-suited for many different kinds of data, including:
- Tabular data with heterogeneously-typed columns, as in an SQL table or Excel spreadsheet
- Ordered and unordered time series data, such as stock market data
- Arbitrary matrix data (homogeneously typed or heterogeneous) with row and column labels
- Any other form of observational/statistical data sets.
The tools provided by Pandas save time and space and are an indispensable part of any data scientist’s toolkit.
Matplotlib
Matplotlib is a plotting library in Python, which means it helps you create charts and graphs from data. It's very popular for its ability to produce a wide variety of graphs and plots with just a few lines of code. Think of it as a tool for turning data into pictures that can help you or others understand trends, patterns, and relationships.
For example, if you have data on daily temperatures and rainfall over a year, you can use Matplotlib to create a line graph of temperatures, a bar chart of rainfall, or even more complex visualizations. It's very flexible: you can customize almost every element of a plot, from colors and labels to the size of lines and type of markers.
Matplotlib works well with many other libraries, including NumPy and Pandas, making it a central component of many data science and analysis workflows in Python. It's especially good for making graphs quickly to get a visual look at data, or for preparing publication-quality figures in various formats. It's like having a digital sketchpad for data.
Scikit-learn

Scikit-learn is a library in Python that is specifically built for predictive data analysis, which is a part of the field known as machine learning. Machine learning is about teaching computers to recognize patterns or make predictions based on the data they are given.
Scikit-learn makes it easy for programmers to access and use a wide range of algorithms for tasks like:
- Classifying information (for example, deciding whether an email is spam or not spam)
- Regressing to predict continuous values (like predicting the price of a house based on its features like size and location)
- Clustering data into groups with similar features (such as grouping customers by buying behavior)
- Reducing the complexity of data to understand it better (like simplifying large sets of variables to the most important ones)
The library provides tools for data mining and data analysis and is built on NumPy, SciPy, and Matplotlib. This means it integrates well with these other libraries, making it a versatile and powerful tool for data scientists. It's particularly praised for its clean, understandable code, and great documentation which helps beginners to get a good start and professionals to get their job efficiently done.
Scikit-learn is widely used because it's both powerful and easy to use. Even without deep knowledge of machine learning, you can use Scikit-learn to include machine learning in your programs, making it a highly valuable tool for developers who want to implement machine learning easily and efficiently.
SciPy

SciPy is a library in Python that is used for scientific and technical computing. It builds on NumPy, which provides support for arrays and matrices, and adds a collection of algorithms and high-level commands for manipulating and analyzing data. SciPy is designed to work with numerical data, but it goes beyond simple mathematical operations.
SciPy includes modules for optimization, linear algebra, integration, interpolation, special functions, FFT (Fast Fourier Transform), signal and image processing, ODE (Ordinary Differential Equations) solvers, and other tasks common in science and engineering.
For example, if you're working in physics, engineering, or mathematics, and you need to solve a complicated differential equation, perform a Fourier transform, or even optimize a function to find its minimum value, SciPy has tools that can help. These are all tasks that involve complex mathematical computations which SciPy makes easier and faster to perform using Python.
In simple terms, you can think of SciPy as a collection of mathematical algorithms and convenience functions built on the Python NumPy extension. It adds significant power to interactive Python sessions by providing the user with high-level commands and classes for managing and visualizing data. SciPy helps turn Python into a powerful tool for scientific and analytical computing.
TensorFlow

TensorFlow is a powerful library developed by Google for creating machine learning models, which are algorithms that allow computers to learn from and make decisions based on data. TensorFlow is particularly well-known for its capabilities in handling deep learning tasks, which are a subset of machine learning involving large neural networks—systems inspired by the human brain that can recognize patterns and make predictions.
With TensorFlow, you can build and train models that can do things like recognize objects in images, understand spoken words, or predict trends in financial markets. It's designed to be flexible and scalable, meaning it can handle large amounts of data and complex computations efficiently, whether on one computer or across a network of thousands.
TensorFlow works by allowing developers to create dataflow graphs, which are structures that map the flow of data through various processing nodes. This modular structure allows for efficient computation and is highly adaptable to various computing platforms, from desktops to clusters of servers.
Keras

Keras is a library in Python that's designed to make building neural networks—complex algorithms modeled after the human brain—easy and fast. It acts as an interface for the TensorFlow library, streamlining the process of machine learning and deep learning, which are used to make predictions or decisions without being explicitly programmed to perform the task.
Keras simplifies the work of creating and training neural networks with its high-level building blocks like layers, objectives, activation functions, and optimizers. This makes it accessible for people who are new to machine learning, while also being sufficiently robust and flexible for research scientists to build complex experiments.
For example, if you want to create a model that can recognize objects in photos, predict customer behavior, or generate recommendations, Keras allows you to assemble these large and complex neural networks quickly. It wraps the efficient numerical computation libraries TensorFlow and Theano, making sure you can both design and deploy your models with just a few lines of code.
Keras emphasizes ease of use, modularity, and extensibility, making it ideal for beginners who are making their first steps in machine learning, as well as researchers aiming to develop state-of-the-art models in a more intuitive and flexible manner.
Seaborn

Seaborn is a library in Python that specializes in creating statistical graphics. It's built on top of Matplotlib, another visualization library, but Seaborn makes it easier to generate more attractive and informative statistical plots.
Think of Seaborn as a tool that helps you visualize data so that patterns, trends, and relationships become more apparent, which might not be obvious just by looking at numbers. It provides a high-level interface for drawing attractive statistical graphics, such as heatmaps, time series, violin plots, and scatter plots. These types of visualizations are particularly useful in the exploratory data analysis phase when you're trying to understand the data and the underlying patterns.
For example, if you're working with data that shows the grades of students across different exams, Seaborn can help you quickly create plots that show distributions of grades, relationships between different exams, and trends over time. This makes it an invaluable tool for data scientists who need to communicate their findings clearly and effectively.
Seaborn's integration with Pandas DataFrames makes it even more user-friendly, as you can leverage DataFrame structures to organize and manipulate data easily before plotting. This integration simplifies the process of turning raw data into insightful visualizations, making Seaborn a favorite among data analysts and scientists for statistical exploration.
Plotly
Plotly is a powerful library for creating interactive graphs and charts in Python. It allows you to build complex visualizations that users can interact with, such as zooming in on details, hovering to get more information, or updating the data shown in real-time.
Plotly is particularly popular because it can create a wide variety of visualizations, from basic charts like line graphs and bar charts to more complex types such as 3D models and geographical maps. These capabilities make it useful not just for data scientists but also for businesses and educators who need to present data in an engaging and informative way.
One of the standout features of Plotly is that it integrates well with web technologies. This means you can easily embed the visualizations you create into websites or apps, making it a great choice for projects that need to be accessible on the internet. Additionally, Plotly supports a range of programming languages, including Python, R, and JavaScript, which gives it versatility in different development environments.
Overall, Plotly stands out for its ability to make visually appealing and interactive graphs that can help turn complex data into insights that are easier to understand and engaging to explore.
PyTorch
PyTorch is a library in Python widely used for machine learning and artificial intelligence, particularly in the areas of deep learning and neural networks. Developed by Facebook's AI Research lab, it's known for its flexibility and speed, which make it a popular choice among researchers and developers.
The main appeal of PyTorch is its use of dynamic computation graphs, which are structures that allow you to change how the network behaves on the fly. This is particularly useful for projects where you might not know everything about the network architecture upfront. In simpler terms, it lets you adjust how your program learns from data as it's running, which can be very helpful for complex, evolving tasks.
PyTorch is also user-friendly, providing a straightforward way of building neural networks through something called "tensors." Tensors in PyTorch are similar to arrays and matrices, and they allow for efficient manipulation of large amounts of data, which is essential in machine learning.
In addition to building and training neural networks, PyTorch offers tools for everything from image and video processing to natural language processing and more. It’s particularly favored in academic and research settings for its ease of use, efficiency, and the ability to prototype quickly. This combination of features makes PyTorch a key tool for developing sophisticated AI applications that can learn from and adapt to real-world data.
Choosing the Right Python Tool: A Decision-Making Framework for Data Scientists
Choosing the best Python library for your data science or machine learning project depends on several factors including the specific task at hand, your proficiency with Python, and the complexity of the data or models involved. Here’s a breakdown to help guide your choice based on common scenarios:
Data Manipulation and Analysis:
- Pandas: Ideal for data cleaning, transformation, and analysis. It's especially good if you're dealing with tabular data similar to what you'd find in spreadsheets.
- NumPy: Best for numerical data. It's crucial when performance is a key concern and when you're working with arrays and matrices.
Statistical Analysis:
- SciPy: Great for scientific and technical computations where you might need to do things like integrations, solving differential equations, and optimization.
- StatsModels: Use this if you need to perform statistical modeling. This includes tests and exploring data distributions.
Machine Learning:
- Scikit-learn: The go-to library for implementing machine learning algorithms, including both supervised and unsupervised learning. It’s known for its ease of use in creating complex models.
- XGBoost: Ideal for competitive machine learning and any scenario where decision-tree-based algorithms are required, particularly for large datasets.
Deep Learning:
- TensorFlow: Highly scalable and comes with a lot of flexibility through its comprehensive set of tools and libraries for deep learning.
- PyTorch: Preferred for academic and research projects due to its ease of use, simplicity, and dynamic computation graph feature.
- Keras: Best for beginners in deep learning. It works as a wrapper for TensorFlow, making complex models more accessible and easier to build.
Visualization:
- Matplotlib: Suitable for making graphs and plots. It's very customizable but can be complex for beginners.
- Seaborn: Built on top of Matplotlib, it simplifies the creation of beautiful, statistical graphics.
- Plotly: If you need interactive plots that can be embedded in web applications, Plotly is superior.
Specialized Tasks:
- NLTK or spaCy: Use these for natural language processing (NLP).
- OpenCV: Ideal for computer vision tasks, from simple to complex image processing.
When choosing a library, also consider the community support and documentation available. Libraries like TensorFlow, PyTorch, and Pandas have large communities and extensive documentation, making it easier to find help and resources. Ultimately, the right library is the one that fits your project requirements and your personal or team skill set.
Pros and cons of using Python libraries for data science
Using Python libraries for data science has its upsides and downsides. Here’s a simple explanation of these, and how they compare to using another popular language called R, which is also widely used in data science for statistical analysis and creating graphs.
Pros of Using Python libraries
- Python's syntax is clear and intuitive, making it accessible for beginners.
- Offers a wide range of libraries for virtually every data science need, from Pandas for data analysis to Scikit-learn for machine learning.
- A large and active community provides extensive resources, help from other developers, and a wealth of shared knowledge and tools.
- Integrates smoothly with other systems and applications, enhancing utility in complex data environments.
- Most Python libraries are open source, reducing costs and benefiting from frequent updates and collaborative improvement.
- Suitable for various tasks beyond data science, including web development and automation, making it highly versatile.
- Runs on multiple operating systems like Windows, MacOS, and Linux, offering flexibility in deployment.
- Libraries like Matplotlib and Seaborn make data visualization straightforward, producing insightful and attractive graphs and charts.
- Allows for rapid prototyping, enabling quick development and testing of new ideas and algorithms in data science.
- Continuously improved and updated, ensuring Python remains cutting-edge in technology and data science trends.
Cons of Using Python libraries
- Python can be slower than other languages like C++ or Java, especially with very large datasets or demanding real-time processing tasks.
- It can consume a lot of memory, which might be challenging when handling large data sets on machines with limited resources.
- Python abstracts many details from the user, simplifying coding but reducing control over performance optimization.
- Managing different versions of Python and its libraries can be challenging and prone to conflicts.
- While Python is easy to learn at a basic level, mastering its libraries for advanced applications requires significant time and effort.
- Python's Global Interpreter Lock (GIL) limits the effectiveness of multi-threading, which can impact performance in multi-operation tasks.
- Python and its libraries can have security vulnerabilities that need regular updates and patches.
- Python's dynamic type system can lead to runtime bugs, increasing the need for extensive testing and debugging.
Conclusion
In conclusion, Python offers a treasure trove of libraries that make it a top choice for data science. Whether you're analyzing data, building machine learning models, or creating beautiful visualizations, there's almost certainly a Python library that can help. While there are some drawbacks, like speed and memory usage, the ease of use, strong community support, and the sheer versatility of Python libraries often outweigh these issues. So, if you're diving into data science, Python is a fantastic starting point that will serve you well throughout your journey.
