


Top 12 Data Engineering Platforms for Data Pipeline Automation


What are data engineering platforms?
Companies generate massive amounts of data, but raw data alone doesn’t drive insights or innovation. That’s where data engineering platforms come in.
Data engineering platforms are specialized tools that help teams build, manage, and automate data pipelines.
These platforms support critical processes like data ingestion, transformation (ETL/ELT), quality checks, orchestration, and storage integration.
They're used across industries from eCommerce and finance to healthcare and logistics to power dashboards, train AI models, and ensure teams are working with clean, timely, and well-structured data.
In this guide, we’ll explore the top 12 data engineering platforms that teams rely on to build efficient and resilient data infrastructure.
How Data Engineering Platforms Support Key Industries
1. Finance & Banking
Data platforms help ingest data from payment systems, credit bureaus, and trading activity. They support fraud detection, customer segmentation, and reporting by enabling structured pipelines that clean and organize financial records. Time-sensitive alerts and regulatory audits rely on accurate and frequent data updates, made possible through automated workflows.
2. Healthcare & Life Sciences
In hospitals and labs, data comes from wearables, EMRs, diagnostic machines, and patient management systems. Data engineering platforms help connect these sources, format the inputs correctly, and prepare data for outcome tracking, research, or compliance. They are key in maintaining audit trails and preparing datasets for clinical studies.
3. eCommerce & Retail
Retailers use these platforms to sync customer behavior, sales trends, and supply chain data. They enable product recommendation engines, inventory forecasts, and personalized marketing. By ensuring that pricing, stock levels, and user data are aligned across systems, businesses can improve both logistics and customer experience.
4. Manufacturing & IoT
Factories generate massive logs from machines, sensors, and production lines. Data engineering platforms are used to collect logs from various sources, monitor system performance, and analyze maintenance needs. Historical data is also combined with environmental inputs to help optimize throughput and reduce delays.
5. Media & Entertainment
Video streaming, content licensing, and viewer engagement require platforms that can collect logs from mobile apps, web interfaces, and smart devices. These tools allow content teams to understand user preferences, improve recommendation engines, and manage ad performance by consolidating viewing metrics and feedback.
6. Logistics & Transportation
Fleet data, warehouse scans, GPS logs, and delivery events all need to be aligned to track movement and delays. Data engineering platforms automate these integrations so companies can plan routes, manage fuel use, and respond to delivery issues more efficiently. Clean data helps identify where hold-ups happen and how systems can be adjusted.
7. Education Technology
EdTech platforms collect data on course interactions, student assessments, and engagement levels. Data pipelines help unify these inputs, allowing educators and admins to measure learning outcomes, personalize content, and refine platforms based on performance trends.
Here is a list of the best data engineering platforms best suitable for enterprise needs
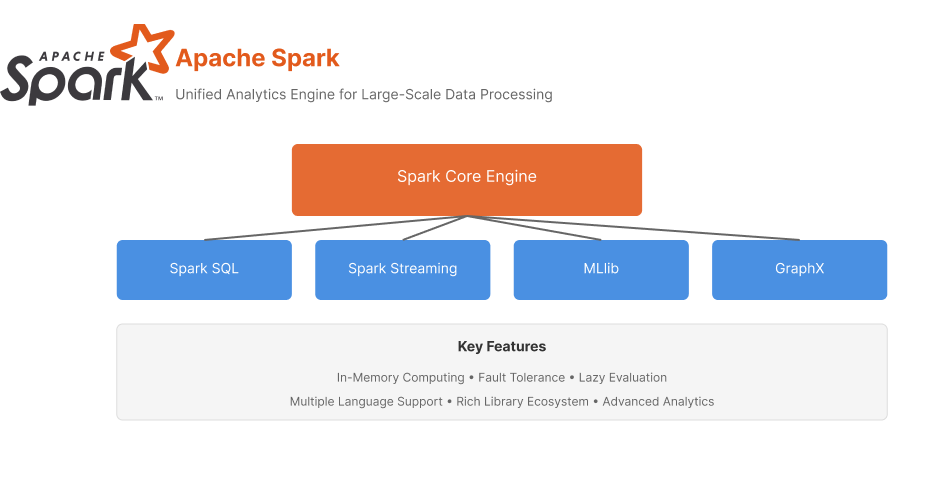
1. Apache Spark
Overview
Apache Spark remains the cornerstone of big data processing in 2024, offering unmatched capabilities for large-scale data processing and analytics. Its unified engine for distributed data processing has continued to evolve with significant improvements in performance and usability.
Key Features
Best Suited For
Large enterprises require robust data processing capabilities, especially those dealing with batch and stream processing at scale. Particularly valuable for organizations with existing Hadoop ecosystems.
2. Tableau
.png)
Tableau is a powerful and user-friendly data visualization and business intelligence tool.
It was founded in 2003 by Chris Stolte, Pat Hanrahan, and Christian Chabot as a result of a computer science project at Stanford University.
The goal was to make data more accessible through intuitive visualizations.
Key Features of Tableau
- Drag-and-Drop Interface
- Wide Range of Visualization Options
- Data Connectivity
- Interactive Dashboards
- Collaboration Tools
How can you use Tableau across industries?
Tableau is used across various industries and departments to drive data-driven decision-making. Some common use cases include
Marketing: Monitor social media and email campaigns, tracking customer engagement, and analyzing campaign performance.
Sales: Track sales performance, set goals, and analyze sales data to identify trends and opportunities.
Finance: Analyze financial data, track expenses, and create financial reports.
Operations: Monitor inventory levels, tracking shipments, and optimizing logistics
3. Apache Airflow
 1.png)
Apache Airflow is an open-source platform to programmatically author, schedule, and monitor workflows. It was initiated by Airbnb in October 2014 to address the increasing complexity of managing data pipelines. Airflow became an Apache Software Foundation project in March 2019.
Key Features of Apache Airflow
- Python-native DAG definitions
- Scheduling, retries, dependency tracking
- Web UI for monitoring workflows
Best Suited For
Teams needing controlled execution of complex data tasks (ETL, batch jobs, model training).
4. Databricks
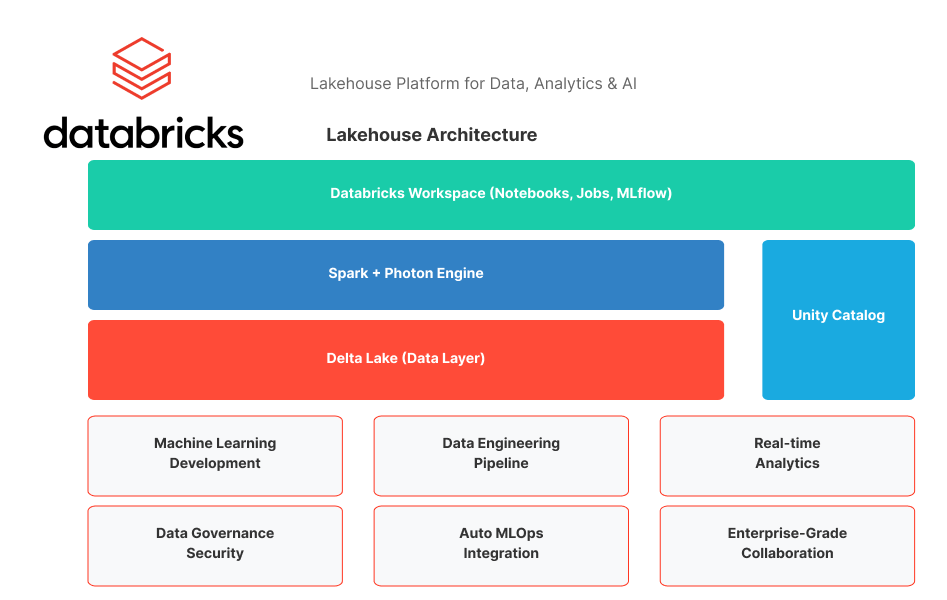
Databricks is a unified analytics platform that helps organizations build, deploy, share, and maintain enterprise-grade data, analytics, and AI solutions at scale. It was founded by the creators of Apache Spark and offers a range of products and services, including a data lakehouse, Delta Lake, Delta Engine, and more.
Key Features of Databricks
Unified Analytics Platform
Databricks integrates data engineering, data science, and AI on a single platform.
Data Lakehouse
Combines the best features of data lakes and data warehouses, providing a unified storage solution for all data types.
Delta Lake
An open-source storage layer that brings ACID (Atomicity, Consistency, Isolation, Durability) transactions to Apache Spark and big data workloads.
Generative AI
Databricks leverages generative AI to optimize performance and manage infrastructure.
Natural Language Processing (NLP)
Uses NLP to help users search and discover data by asking questions in their own words.
Open Source Integration
Databricks supports open-source projects like Apache Spark, MLflow, and Delta Sharing.
Security and Governance
Provides strong governance and security features to ensure data privacy and control.
How can you use Databricks across industries?
ETL Pipelines: Extracting, transforming, and loading data from various sources.
Data Warehousing: To store and manage large datasets for analytics and reporting.
- Machine Learning and AI: Building, training, and deploying machine learning models.
- Data Governance: Ensure data quality, lineage, and security
Best Suited For
Enterprises running large-scale analytics and machine learning on Spark.
5. Microsoft Power BI
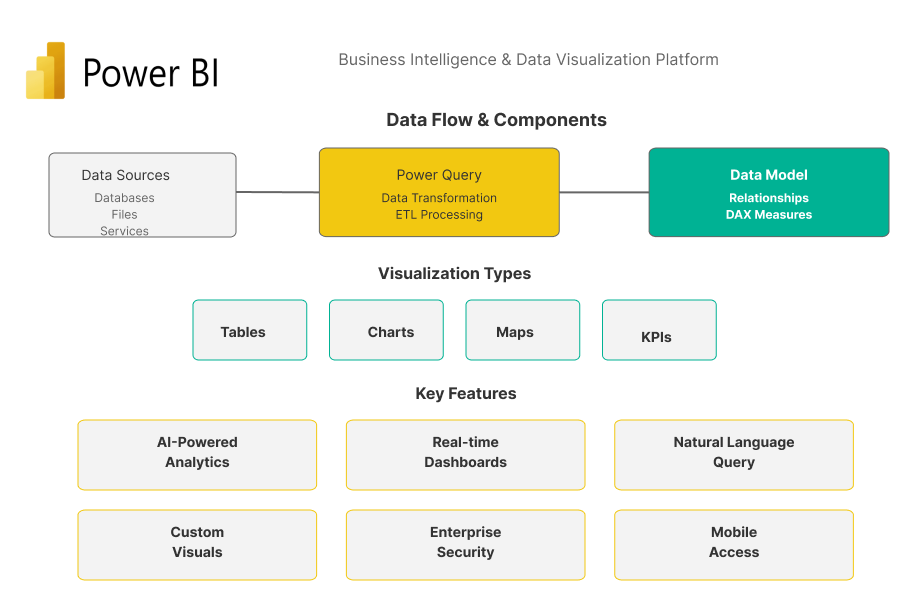
Microsoft Power BI is a suite of business analytics tools designed to analyze data and share insights. It was launched by Microsoft in 2015 and has since become a popular choice for data analysis and visualization due to its robust features and integration with other Microsoft products.
Key Features of Power BI
Interactive Dashboards
Power BI allows users to create interactive dashboards with real-time updates, providing a dynamic view of their data.
Data Connectivity
Power BI supports a wide range of data sources, including databases, spreadsheets, cloud services, and web data.
Powerful Visualizations
Users can choose from a variety of visualizations, such as charts, graphs, and maps, to represent their data effectively.
Natural Language Queries
The platform allows users to ask questions about their data using natural language, making it accessible to non-technical users.
Integration with Microsoft Products
Power BI integrates seamlessly with other Microsoft products like Excel, Azure, and SQL Server.
Mobile Access
Power BI offers mobile apps for iOS and Android, allowing users to access their dashboards and reports on the go.
Collaboration and Sharing
Users can share their reports and dashboards with colleagues, facilitating collaboration and decision-making.
How can you use Power BI across industries?
Finance: Analyze financial data, track expenses, and create financial reports.
Marketing: Monitor campaign performance, track customer engagement, and analyze marketing data.
Sales: To track sales performance, set goals, and analyze sales data to identify trends and opportunities.
Operations: Monitor inventory levels, tracking shipments, and optimizing logistics
6. Apache Kafka
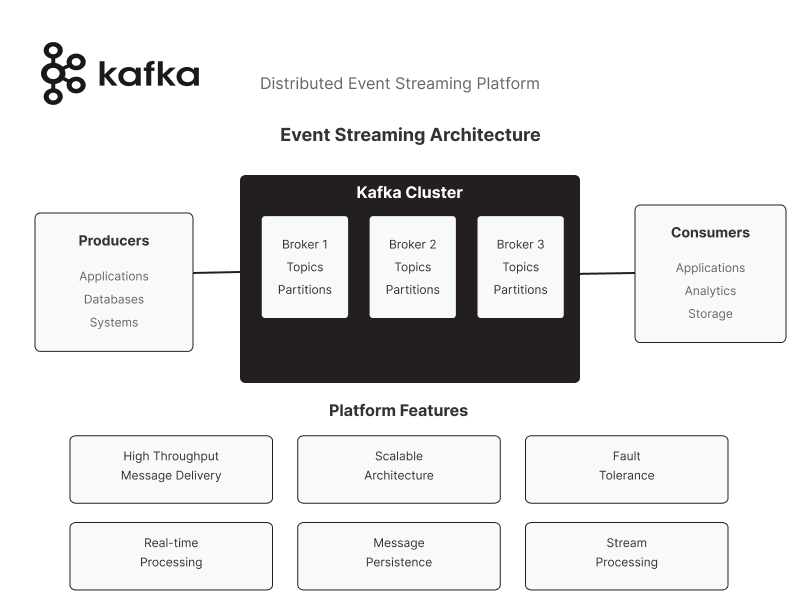
Amazon Managed Streaming for Apache Kafka (Amazon MSK) is a fully managed service that simplifies running Apache Kafka on AWS. It provides a scalable, secure, and highly available platform for streaming data
Key Features of Apache Kafka
Fully Managed Service
Amazon MSK handles the provisioning, configuration, and maintenance of Kafka clusters, allowing developers to focus on building applications.
High Availability and Scalability
It supports multi-AZ deployments and automated detection, mitigation, and recovery of infrastructure.
Integration with AWS Services
Amazon MSK integrates seamlessly with other AWS services, such as S3, Lambda, and DynamoDB.
Security
Provides enterprise-grade security features, including encryption, access control, and network isolation.
Cost-Effective
Offers pay-as-you-go pricing, making it cost-effective for various workloads.
How can you use Apache Kafka across industries?
Log and Event Data Processing: Ingesting and processing log and event streams in real-time.
Centralized Data Buses: Creating real-time, centralized data buses for applications.
Event-Driven Systems: Powering event-driven architectures by responding to changes in real-time.
Data Pipelines: Building data pipelines that move data from one system to another reliably.
7. PostgreSQL
 1 1.png)
PostgreSQL is an open-source, object-relational database management system (ORDBMS) known for its robustness, flexibility, and standards compliance. Initially developed at the University of California, Berkeley, PostgreSQL has been in active development since 1986.
Key Features
Advanced Data Types
Supports a wide range of data types, including JSON, XML, and custom data types.
ACID Compliance
Ensures reliable transactions with atomicity, consistency, isolation, and durability properties.
Extensibility
Allows users to add custom functions, operators, and index types.
Concurrency Control
Uses Multi-Version Concurrency Control (MVCC) to manage concurrent transactions efficiently.
Data Integrity
Provides mechanisms for ensuring data integrity, such as foreign keys, constraints, and triggers.
Full-Text Search
Includes powerful full-text search capabilities.
Replication
Supports various replication methods, including streaming replication and logical replication.
Geospatial Support
Offers advanced geospatial data handling with the PostGIS extension.
How can you use PostgreSQL across industries?
Web Applications: Serves as a robust backend for web applications, ensuring data integrity and performance.
Data Warehousing: Used for data warehousing and analytics, supporting complex queries and large datasets.
Geospatial Applications: With the PostGIS extension, PostgreSQL is ideal for geospatial applications, handling complex spatial queries and data.
Enterprise Applications: Supports enterprise applications requiring high reliability, performance, and scalability.
8. Amazon Redshift
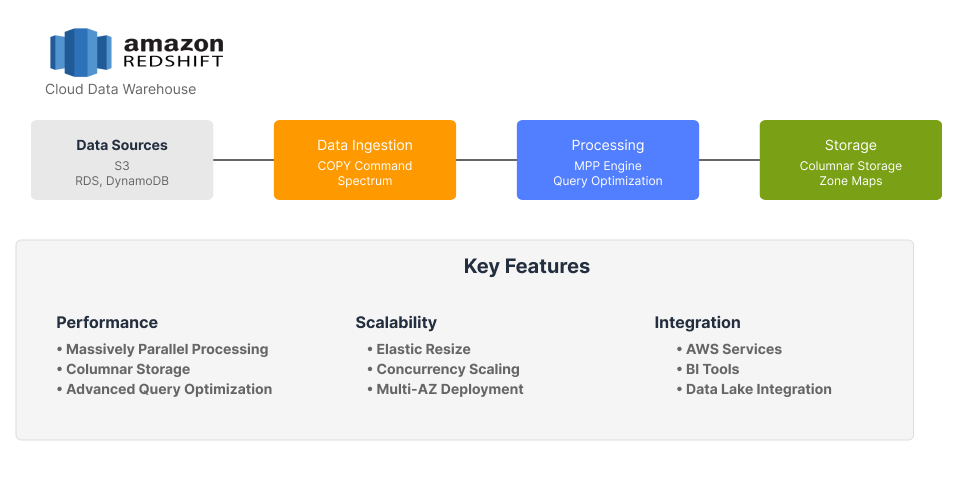
Amazon Redshift is a fully managed, petabyte-scale data warehouse service in the cloud, offered by Amazon Web Services (AWS). It is designed to handle large-scale data sets and complex queries with high performance.
Key Features
Fully Managed Service
Amazon Redshift handles provisioning, configuration, and maintenance, allowing users to focus on analyzing data.
Massively Parallel Processing (MPP)
Redshift uses MPP to distribute and parallelize queries across multiple nodes, ensuring fast query performance.
Data Warehousing
Redshift is optimized for data warehousing, providing powerful SQL-based tools for data analysis.
Integration with AWS Services
Integrates with other AWS services like S3, Lambda, and SageMaker.
Security
Offers comprehensive security features, including encryption, access controls, and network isolation.
Scalability
Easily scales to handle petabytes of data without the need for manual intervention.
Serverless Option
Amazon Redshift Serverless allows users to analyze data without managing infrastructure, paying only for what they use.
How can you use Amazon Redshift across industries?
Business Intelligence: Creating dashboards and reports for business insights.
Data Warehousing: Storing and managing large datasets for analysis.
Machine Learning: Feeding data into machine learning models for predictions and insights.
Log and Event Data Processing: Analyzing log and event data in real-time.
9. DBT (Data Build Tool)
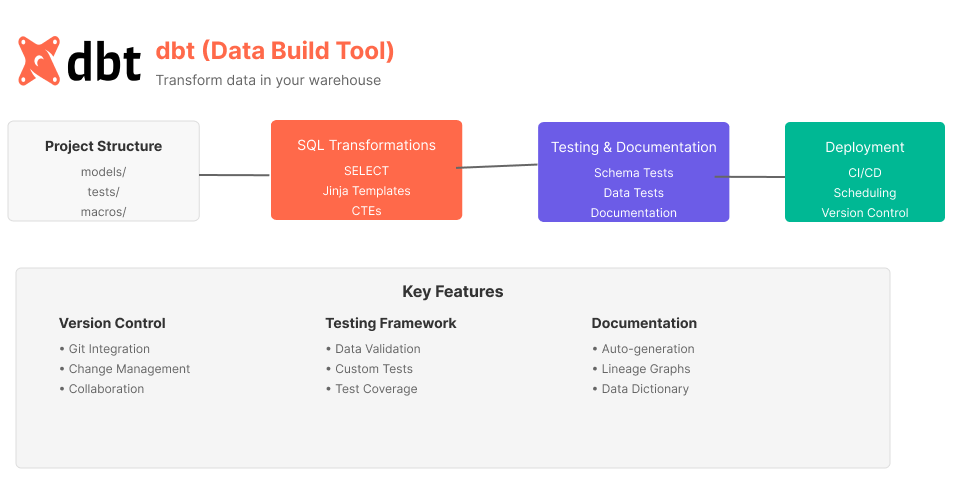
DBT (Data Build Tool) is an open-source software tool that enables data analysts and engineers to transform and model data in the data warehouse. It simplifies the ETL (Extract, Load, Transform) process by focusing on the transformation aspect, making it easier to create reliable and maintainable data pipelines.
Key Features
SQL-Based
DBT uses SQL for data transformation, making it accessible to anyone familiar with SQL.
Modular Design
Breaks down data transformation logic into modular components, making it easier to manage and update.
Testing
Built-in testing capabilities ensure data quality and consistency.
Documentation
Automatically generates documentation for data models, making it easier for teams to collaborate.
Version Control
Integrates with version control systems like Git, allowing teams to track changes and collaborate more effectively.
Scheduling
Supports scheduling of data transformation jobs, ensuring that data pipelines run at the right times.
How can you use DBT across industries?
ETL Pipelines: Transforming raw data into analysis-ready formats.
Data Warehousing: Managing and organizing data in a data warehouse.
Machine Learning: Preparing data for machine learning models.
Business Intelligence: Creating dashboards and reports for business insights.
10. Snowflake
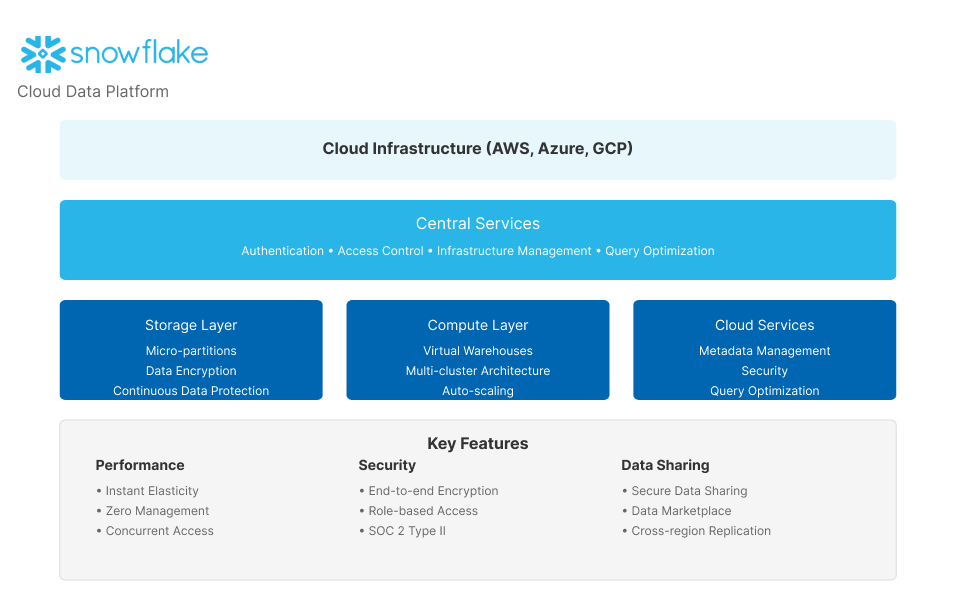
Snowflake is a cloud-based data platform that enables organizations to store, process, and analyze large amounts of data. It offers a fully managed service, meaning users don't need to worry about infrastructure management, allowing them to focus on data insights and analytics.
Key Features
Fully Managed Service
Snowflake handles provisioning, configuration, and maintenance, simplifying data management.
Massively Parallel Processing (MPP)
Uses MPP to distribute and parallelize queries across multiple nodes, ensuring fast query performance.
Flexible Architecture
Supports structured, semi-structured, and unstructured data, providing a unified platform for all data types.
Scalability
Easily scales to handle petabytes of data without manual intervention.
Security
Offers robust security features, including encryption, access controls, and network isolation.
Interoperability
Integrates with various cloud services and on-premises systems, providing flexibility in data management.
Cloud Services
Includes services for AI, machine learning, and data sharing, enhancing data capabilities.
How can you use Snowflake across industries?
Business Intelligence: Creating dashboards and reports for business insights.
Data Warehousing: Storing and managing large datasets for analysis.
Machine Learning: Feeding data into machine learning models for predictions and insights.
Log and Event Data Processing: Analyzing log and event data in real-time.
11. Google BigQuery
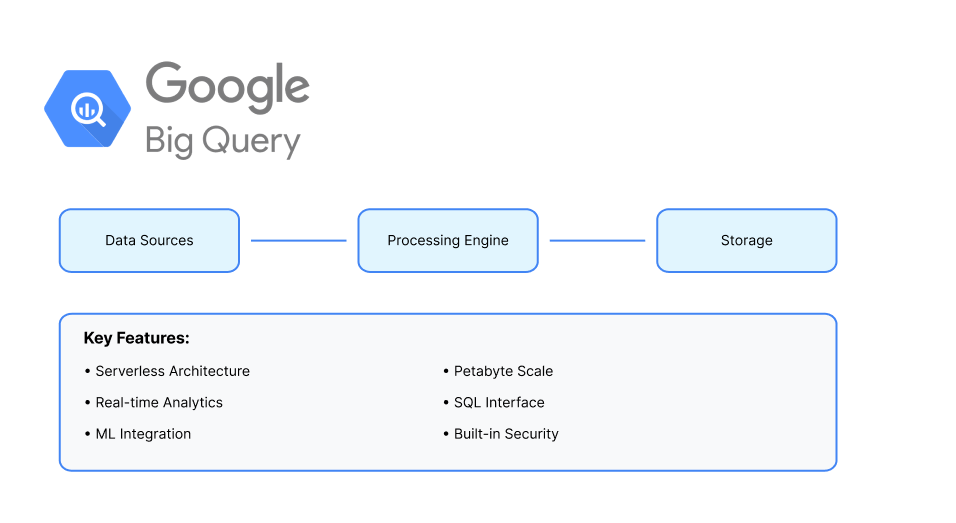
Google BigQuery is a fully managed, serverless data warehouse that enables scalable analysis over petabytes of data. It is designed to be highly flexible and integrates seamlessly with various Google Cloud services.
Key Features
Fully Managed Service
BigQuery handles provisioning, configuration, and maintenance, allowing users to focus on data analysis.
Serverless Architecture
Users don't need to manage infrastructure, and resources are automatically scaled based on workload.
Unified Data Platform
Supports structured, semi-structured, and unstructured data, providing a single platform for all data types.
Built-in Machine Learning
BigQuery ML allows users to create and run machine learning models using simple SQL queries.
Real-Time Analytics
Supports streaming data ingestion and real-time analytics.
Integration with Google Cloud
Integrates with other Google Cloud services like Google Cloud Storage, BigQuery ML, and Google Analytics.
Security: Offers robust security features, including encryption, access controls, and network isolation.
How can you use Google BigQuery across industries?
Business Intelligence: Creating dashboards and reports for business insights.
Data Warehousing: Storing and managing large datasets for analysis.
Machine Learning: Feeding data into machine learning models for predictions and insights.
Log and Event Data Processing: Analyzing log and event data in real-time.
12. Microsoft Azure Synapse Analytics
.png)
Microsoft Azure Synapse Analytics is an enterprise analytics service that accelerates time to insight across data warehouses and big data systems. It combines the best of SQL technologies used in enterprise data warehousing, Apache Spark technologies for big data, and Azure Data Explorer for log and time series analytics.
Key Features
Unified Analytics Platform
Combines data warehousing and big data analytics in a single platform.
SQL and Spark Integration
Integrates SQL and Apache Spark, allowing users to use the best tool for each task.
Data Integration
Includes a powerful data integration engine for ETL/ELT processes.
Machine Learning
Integrates with Azure Machine Learning for building and deploying machine learning models.
Real-Time Analytics
Supports real-time data ingestion and analytics.
Security
Offers robust security features, including encryption, access controls, and dynamic data masking.
Scalability
Easily scales to handle large volumes of data and complex queries.
How can you use Microsoft Azure Synapse Analytics across industries?
Business Intelligence: Creating dashboards and reports for business insights.
Data Warehousing: Storing and managing large datasets for analysis.
Machine Learning: Feeding data into machine learning models for predictions and insights.
Log and Event Data Processing: Analyzing log and event data in real-time.
 WhatsApp
 Call Us
 Mail Us