


7 Steps to Master Data Wrangling with Pandas and Python


What is Data Wrangling?
Data wrangling, also known as data munging, is the process of cleaning, structuring, and enriching raw data into a desired format for better decision-making and analysis. This process is essential for data scientists, analysts, and engineers working with large datasets.
5 Main Steps to Data Wrangling
- Data Acquisition – Gathering data from different sources (CSV, databases, APIs, etc.).
- Data Cleaning – Handling missing values, correcting inconsistencies, and removing duplicates.
- Data Transformation – Converting data types, renaming columns, normalizing, and encoding categorical variables.
- Data Enrichment – Merging datasets, aggregating data, and deriving new features.
- Data Validation & Exporting – Ensuring data quality and exporting clean datasets for further analysis.
What is Pandas?

Pandas is a powerful open-source data analysis and manipulation library for Python. It provides high-performance, easy-to-use data structures such as DataFrames and Series to handle structured data efficiently.
What is Pandas Used For?
- Importing and exporting data from various file formats.
- Cleaning and preprocessing data.
- Performing statistical analysis.
- Filtering, grouping, and aggregating data.
- Merging and joining multiple datasets.
- Visualizing data with built-in functions and integration with Matplotlib & Seaborn.
Key Benefits of Pandas
- Flexible Data Structures: Handles structured and unstructured data seamlessly.
- High Performance: Optimized for fast computation on large datasets.
- Easy Data Cleaning: Built-in functions for handling missing data, duplicates, and outliers.
- Integration with Other Libraries: Works well with NumPy, SciPy, Scikit-Learn, and Matplotlib.
- Intuitive Syntax: Makes data manipulation simpler compared to raw Python operations.
1. Importing Data with Pandas
Before you can work with your data, you must import it into a Pandas DataFrame. Pandas makes it easy to read from various file formats such as CSV, Excel, JSON, and even SQL databases. Understanding the different ways to import data efficiently can save time and optimize memory usage.
Reading Different File Types
import pandas as pd

# Import data from a CSV file
df_csv = pd.read_csv('data.csv')

# Import data from an Excel file
df_excel = pd.read_excel('data.xlsx')

# Import data from a JSON file
df_json = pd.read_json('data.json')

# Import data from a SQL database (using SQLAlchemy for the connection)
from sqlalchemy import create_engine
engine = create_engine('sqlite:///data.db')
df_sql = pd.read_sql('SELECT * FROM table_name', engine)
Best Practices:
- Use
index_colwhile reading data to set a specific column as the index. - Use
dtypeto specify data types for better memory management. - Handle large files efficiently using
chunksize. - Use
na_valuesto specify custom missing value representations. - Read compressed files with
compression='gzip'orzip.
2. Exploring the Data
Once your data is loaded, it’s important to explore its structure and contents. Pandas offers functions like head(), info(), and describe() to help you get a quick overview. Properly exploring your data helps in identifying potential inconsistencies, anomalies, and missing values.
Key Functions to Explore Data
# Display the first few rows
print(df_csv.head())

# Get a concise summary of the DataFrame
print(df_csv.info())

# View summary statistics for numeric columns
print(df_csv.describe())

# Check unique values per column
print(df_csv.nunique())

# Identify duplicate values
print(df_csv.duplicated().sum())
Additional Tips:
- Use
df.sample(n=5)to view a random subset of the data. - Use
df.dtypesto inspect data types. - Use
df.memory_usage(deep=True)to check memory usage.
3. Handling Missing Data
Missing data is common in real-world datasets. Pandas provides simple methods to detect and handle these gaps, ensuring data consistency and accuracy.
Detecting Missing Data
# Check for missing values in each column
print(df_csv.isnull().sum())

# Visualizing missing data
import seaborn as sns
import matplotlib.pyplot as plt
sns.heatmap(df_csv.isnull(), cmap='viridis', cbar=False)
plt.show()
Handling Missing Values
# Drop rows with any missing values
df_dropped = df_csv.dropna()

# Fill missing values with forward-fill
df_filled = df_csv.fillna(method='ffill')

# Fill missing values with specific values
df_filled_custom = df_csv.fillna({'column_name': 'default_value'})
Advanced Techniques:
- Use
df.interpolate()for numerical data to estimate missing values. - Fill categorical missing values using
df.mode().iloc[0]. - Use
sklearn.impute.SimpleImputerfor ML-based imputation.
4. Data Transformation and Cleaning
Transforming raw data into a structured format is crucial. This step involves renaming columns, changing data types, handling duplicate values, and applying transformations.
Common Data Cleaning Techniques
# Rename columns for clarity
df_clean = df_csv.rename(columns={'old_name': 'new_name'})

# Convert a column to datetime
df_clean['date'] = pd.to_datetime(df_clean['date'])

# Remove duplicate rows
df_clean = df_clean.drop_duplicates()
Additional Data Transformation Steps:
- Normalize numerical data using Min-Max scaling.
- Encode categorical data using
pd.get_dummies(). - Strip whitespace from text fields using
.str.strip().
5. Filtering and Selecting Data
Often, you need to focus on specific subsets of your data. Pandas allows you to filter rows, select particular columns, and even perform group-based aggregations.
Selecting and Filtering Data
# Filter rows where 'age' is greater than 30
df_filtered = df_clean[df_clean['age'] > 30]

# Select specific columns
df_selected = df_clean[['name', 'age', 'salary']]

# Group by a column and calculate the average salary by department
df_grouped = df_clean.groupby('department')['salary'].mean().reset_index()
Advanced Filtering:
- Use
.query('salary > 50000 & department == "HR"')for complex filtering. - Use
.isin()to filter based on a list of values.
6. Merging and Combining Datasets
Real-world data often comes from multiple sources. You can merge or join DataFrames using Pandas to create a unified dataset.
Merging and Joining DataFrames
# Merge two DataFrames on a common key 'id'
df_merged = pd.merge(df_csv, df_excel, on='id', how='inner')
Advanced Techniques:
- Use
concat()for vertical or horizontal stacking. - Use
merge(how='outer')to retain all data from both datasets.
7. Exporting Clean Data
Once data wrangling is complete, saving the cleaned dataset is crucial. Proper data export ensures your data remains accessible and usable for further analysis, reporting, or machine learning tasks.
Exporting Data
# Export to a CSV file
df_clean.to_csv('clean_data.csv', index=False)

# Export to an Excel file
df_clean.to_excel('clean_data.xlsx', index=False)

# Export to a JSON file
df_clean.to_json('clean_data.json', orient='records', lines=True)

# Export to a Parquet file for efficient storage
df_clean.to_parquet('clean_data.parquet', index=False)
Considerations:
- Use
df.to_parquet()for optimized storage and faster reads compared to CSV. - Use
compression='gzip'when dealing with large datasets. - Ensure correct encoding (UTF-8) when saving files to avoid character issues.
- Save multiple sheets in Excel using
ExcelWriterfor better organization.
with pd.ExcelWriter('clean_data.xlsx') as writer:
    df_clean.to_excel(writer, sheet_name='Cleaned Data')
    df_stats.to_excel(writer, sheet_name='Summary Stats')
Common Mistakes in Data Wrangling
- Ignoring Missing Data – Not addressing missing values can lead to inaccurate analyses.
- Incorrect Data Types – Failing to convert data types can cause errors in calculations.
- Not Handling Duplicates – Duplicate rows can skew results and create inconsistencies.
- Using Inefficient Loops – Avoid looping through DataFrames; use vectorized operations instead.
- Forgetting to Validate Data – Always check data integrity before proceeding with analysis.
Best Practices for Data Wrangling
- Plan Your Workflow – Define data cleaning steps before writing code.
- Use Pandas Built-in Methods – Leverage
apply(), map(),andvectorized operationsfor efficiency. - Automate Repetitive Tasks – Use functions and scripts to streamline data cleaning.
- Document Your Work – Keep clear records of transformations for reproducibility.
- Profile Data Regularly – Use
df.info(), df.describe(), and visualization to inspect data.
Conclusion
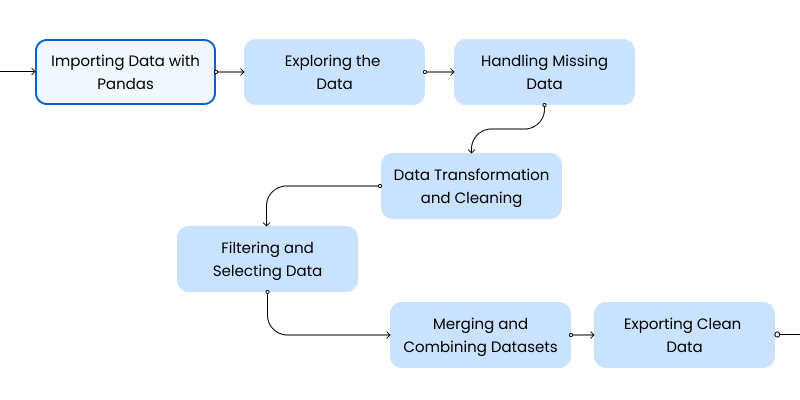
By following these seven steps—importing, exploring, handling missing data, transforming, filtering, merging, and exporting—you will gain the expertise needed for effective data wrangling. Mastering these techniques ensures clean, reliable datasets ready for deeper analysis and machine learning.
Understanding what Pandas is and how to use it efficiently can save time and effort in data manipulation. Avoid common mistakes and follow best practices to ensure high-quality data preparation.
Happy coding and data wrangling!
 WhatsApp
 Call Us
 Mail Us