


How to Load Test Your API Properly: Tools and Process Explained


APIs process the requests that power applications, integrations, dashboards, and mobile experiences.
Every user interaction generates calls that consume compute resources, database connections, and network bandwidth.
As usage increases, these components begin interacting under concurrency rather than isolation.
What does load testing your API mean?
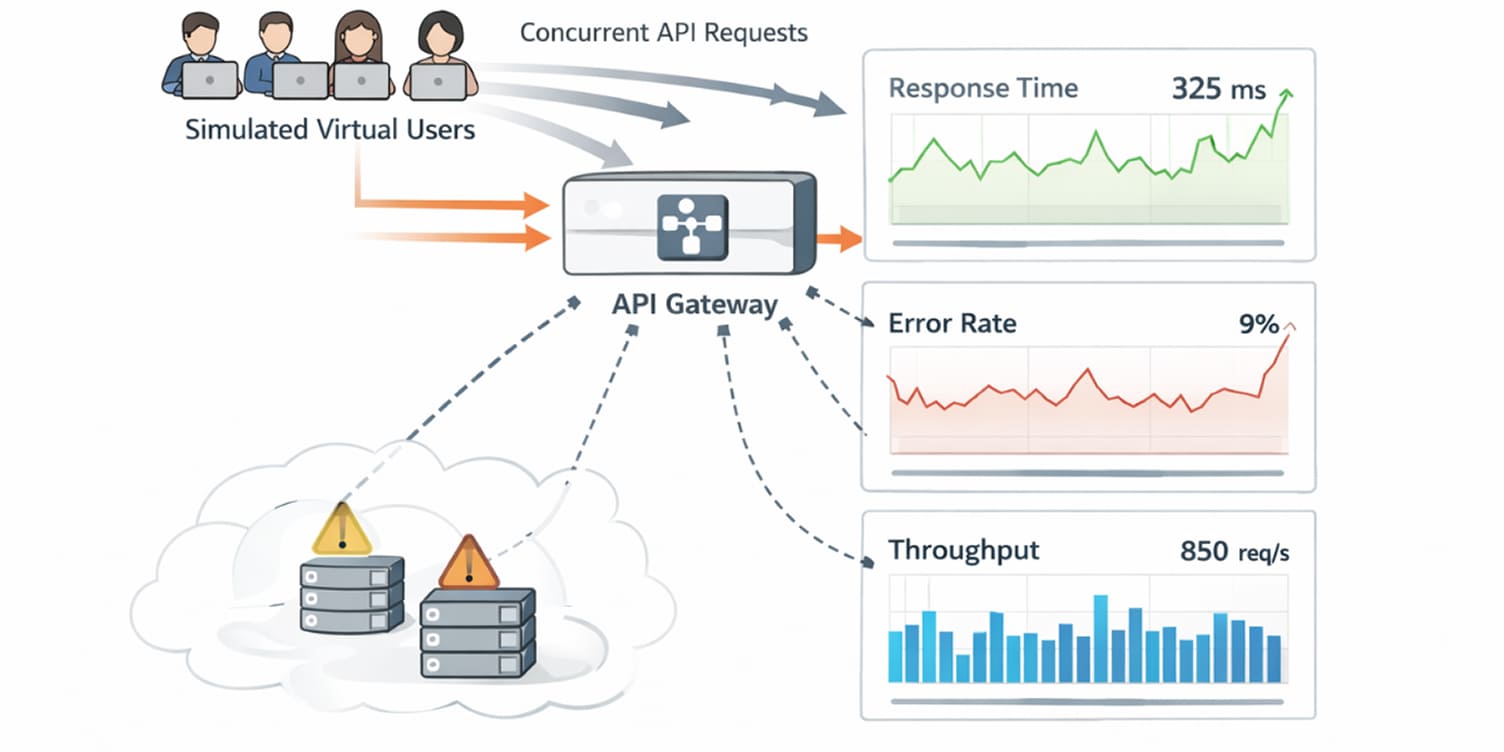
API load testing is the practice of simulating expected levels of concurrent traffic to measure how an API performs under sustained demand.
It evaluates response time distribution, request throughput, error rates, and infrastructure utilization as traffic approaches projected peak conditions.
The goal is to understand operational capacity before those traffic levels occur in production.
What is load testing?
Load testing is the process of simulating realistic traffic against an API to evaluate how it behaves as demand increases.
Rather than simply checking whether endpoints respond, load testing measures how response time, throughput, and system stability change under sustained concurrency.
The goal is to understand operating capacity, not just whether the API works, but how much traffic it can handle before latency degrades, bottlenecks emerge, or failure rates increase.
By observing performance across controlled load levels, teams can identify resource constraints, scaling thresholds, and the point at which user experience begins to deteriorate.
When executed properly, load testing defines the safe operating envelope of an API, ensuring it remains responsive and predictable even during peak usage periods.
Why should you load test your API before scaling?
Developers often ask whether load testing is necessary for APIs that already perform well in staging. The problem is that staging traffic rarely reflects production concurrency.
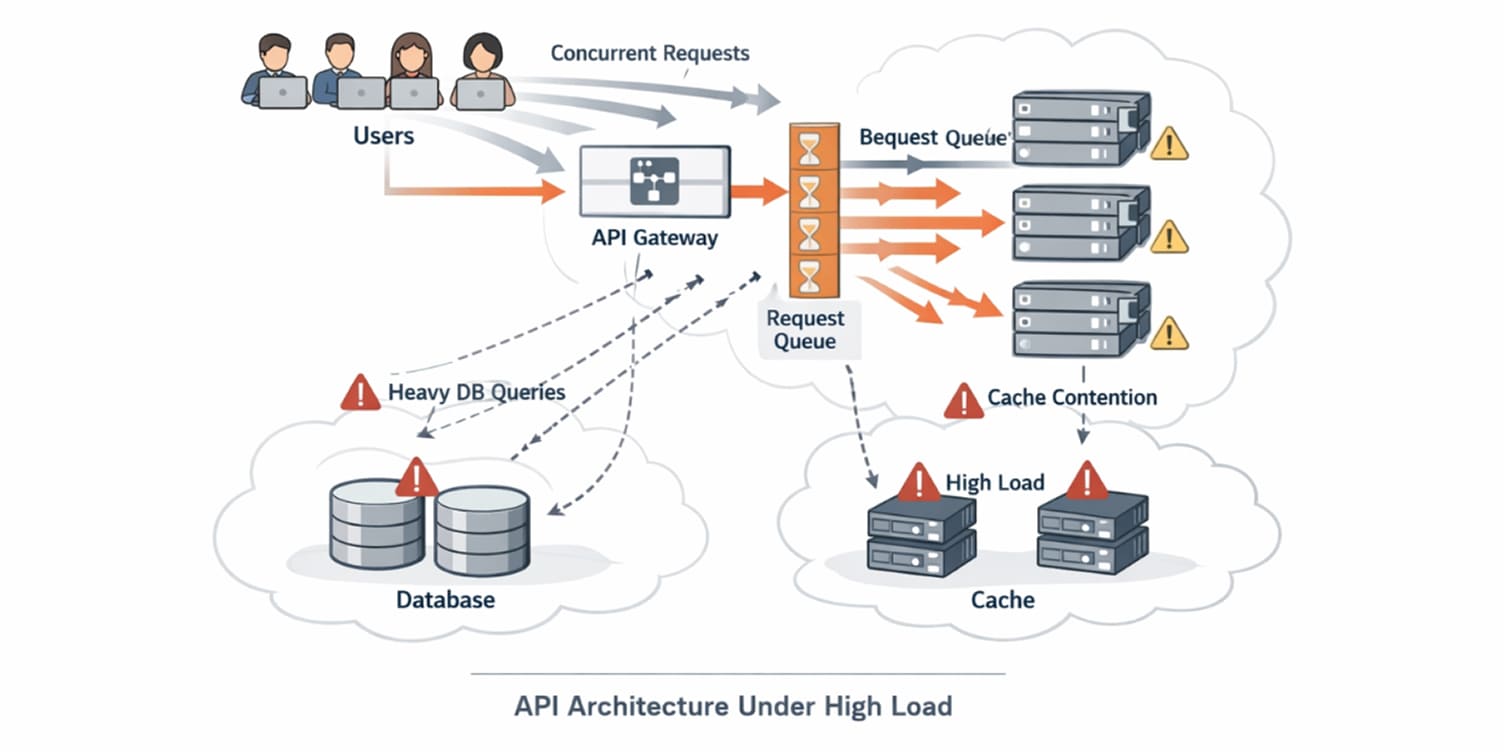
Load testing helps uncover performance bottlenecks under realistic request volumes. As traffic increases, thread pools, database connections, and caching layers begin interacting in ways that are not visible during functional testing.
Identifying these constraints early allows you to address them before growth amplifies their impact.
Load testing also supports capacity forecasting. When you measure how latency and throughput behave at defined concurrency levels, you gain visibility into how much traffic your infrastructure can support.
This becomes essential during product launches, marketing events, or enterprise onboarding phases.
You perform load testing when scaling is expected, when SLA commitments exist, or when infrastructure cost planning depends on accurate performance modeling.
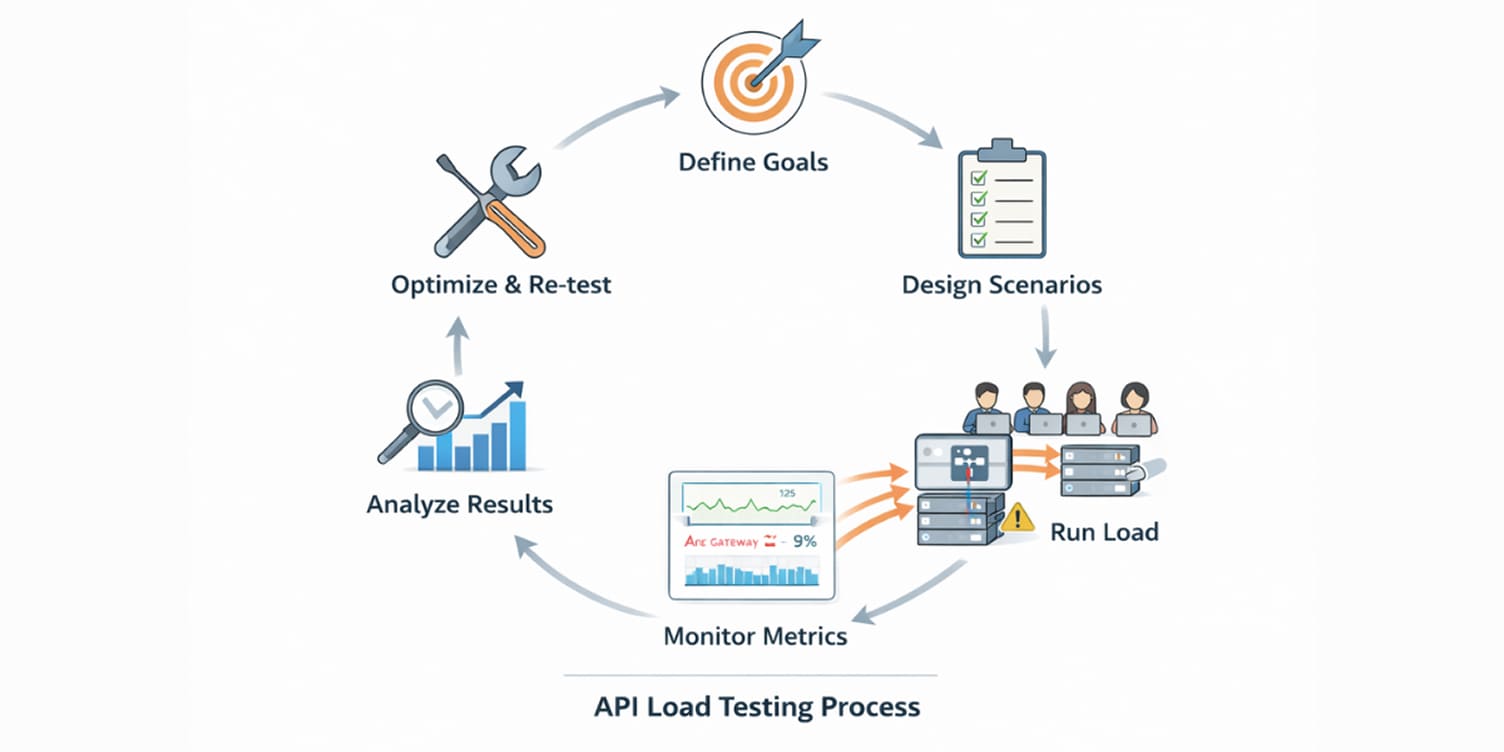
How to load test an API step by step
A structured process ensures load testing produces actionable results instead of random traffic bursts.
Define your goals and benchmarks
Before generating traffic, define acceptable latency thresholds, throughput targets, and error rate limits. Benchmarks should reflect expected user behavior and business tolerance.
For example, if your analytics show peak concurrency of 1,500 users, your benchmark should test that range rather than arbitrary numbers.
Establish service level objectives so results can be evaluated against defined standards.
You define benchmarks when preparing infrastructure upgrades, validating architecture changes, or planning growth.
Choose the right load testing tool
Tool selection affects automation and scalability of execution.
Apache JMeter is widely adopted for configurable test plans and broad protocol support. It suits teams that prefer graphical interfaces.
k6 integrates easily into CI workflows and uses JavaScript for scripting, making it developer-friendly.
Gatling handles high concurrency efficiently and produces detailed reports suitable for capacity planning.
CLI-based tools such as Vegeta and frameworks like Locust provide flexible scripting for distributed load generation.
Design realistic test scenarios
Effective load test solutions simulate real user journeys rather than isolated endpoint calls across typical crud
Include multiple endpoints interacting concurrently. Model authentication flows where tokens are generated and reused.
Vary payload sizes to reflect different request types. Simulate peak traffic conditions separately from normal operating levels.
User think time between requests should be included when modeling workflows. Instant back-to-back calls rarely represent actual usage patterns.
Scenario design becomes especially important when your API supports multiple clients, such as mobile apps, dashboards, and third-party integrations that rely on secure API credentials.
Prepare a production-like test environment
Testing in environments that differ significantly from production leads to misleading results.
Use staging infrastructure that mirrors production instance types, database configurations, and caching layers.
Populate test databases with representative data volumes because small datasets often produce faster query responses.
Sensitive data should be sanitized while maintaining realistic distribution patterns. Environment preparation determines the reliability of performance conclusions.
Execute load tests with a gradual ramp-up
Execution begins with a baseline test under low concurrency to establish stable metrics. Traffic then increases gradually toward projected peak levels.
Observing metric evolution during ramp-up reveals where latency begins deviating from defined thresholds.
The example below illustrates staged traffic and automated performance enforcement using k6.
import http from 'k6/http';
import { check, sleep } from 'k6';

export const options = {
  stages: [
    { duration: '2m', target: 100 },
    { duration: '5m', target: 500 },
    { duration: '2m', target: 0 },
  ],
  thresholds: {
    http_req_duration: ['p(95)<300'],
    http_req_failed: ['rate<0.01'],
  },
};

export default function () {
  const res = http.get('https://api.example.com/v1/orders');
  check(res, { 'status is 200': (r) => r.status === 200 });
  sleep(1);
}
The staged ramp-up models traffic growth, while thresholds define acceptable performance boundaries. If latency or error rates exceed defined values, the test fails automatically.
This approach enables integration into CI workflows where performance regressions must be detected without manual review.
Extended-duration execution can expose degradation patterns that appear after sustained traffic, such as memory growth or connection leaks.
Monitor application and infrastructure layers
Load testing without monitoring reduces insight into raw response numbers.
Track application metrics alongside infrastructure metrics such as CPU usage, memory consumption, database query duration, cache hit ratios, and network throughput as a part of testing your product.
Error breakdowns should be categorized to distinguish between timeouts, validation failures, and server errors.
Comprehensive monitoring ensures you can correlate performance changes with specific components.
Analyze results against benchmarks
After execution, compare observed metrics with predefined goals.
Identify at what concurrency latency begins to deviate from acceptable thresholds. Determine which resource reaches saturation first.
Examine how error rates evolve during ramp-up phases.
Correlating these observations helps isolate bottlenecks. Analysis should lead to specific optimization tasks rather than generalized scaling decisions.
Optimize and re-test
Optimization may involve database query tuning, caching adjustments, connection pool configuration, or infrastructure scaling policies.
After applying changes, repeat load tests using the same scenarios to measure improvement. Consistency in methodology ensures comparisons remain valid.
Re-testing confirms whether performance improvements address root causes or simply shift bottlenecks elsewhere.
Executing a Complete API Load Test

Let’s walk through a full example of running a load test, analyzing the output, and translating results into engineering decisions.
Assume a REST endpoint:
GET /v1/ordersThe objective is to determine how many concurrent users the API can handle while keeping p95 latency below 300 milliseconds and error rate below one percent.
Define the traffic model before writing the script
Before generating traffic, define realistic user behavior. In this scenario, the API should sustain 1,000 concurrent users, with each user pausing about one second between requests to simulate normal interaction.
The steady-state phase should run for five minutes to expose resource contention under sustained load.
Success criteria are predefined: p95 latency must stay under 300ms, and the overall error rate must remain below 1%.
From an FPP perspective, these parameters establish the failure baseline.
Gradual latency growth suggests linear saturation, sharp spikes indicate contention thresholds, stable latency with rising errors signals hard limits, and degradation over the five-minute window points to soak instability.
This keeps it compact while still analytical.
The purpose of defining this upfront is to avoid generating arbitrary load. Capacity testing must reflect production expectations.
Create the load script with enforced performance thresholds
Using k6, the traffic model can be encoded directly into the script.
import http from 'k6/http';
import { check, sleep } from 'k6';

export const options = {
  stages: [
    { duration: '2m', target: 200 },
    { duration: '3m', target: 1000 },
    { duration: '2m', target: 0 },
  ],
  thresholds: {
    http_req_duration: ['p(95)<300'],
    http_req_failed: ['rate<0.01'],
  },
};

export default function () {
  const res = http.get('https://api.example.com/v1

const res = http.get('https://api.example.com/v1/orders');

  check(res, {
    'status is 200': (r) => r.status === 200,
  });

  sleep(1);
}
The staged ramp increases concurrency gradually from 200 users to 1,000 users before tapering down. The threshold configuration defines measurable success criteria.
If 95 percent of requests exceed 300 milliseconds or if the failure rate surpasses one percent, the test exits with a failed status code.
Encoding thresholds directly inside the script transforms the load test into an enforceable contract. This approach prevents subjective interpretation of performance results.
Execution is initiated from the command line:
k6 run load-test.jsThe command produces a summary report in the terminal after completion
Interpret the load test output
A typical execution summary might resemble the following:
checks.........................: 100.00% ✓ 15000 ✗ 0
http_req_duration..............: avg=210ms p(95)=285ms p(99)=420ms
http_req_failed................: 0.45%
http_reqs......................: 15000
vus_max........................: 1000
Each metric answers a specific operational question.
The total request count confirms that traffic volume matched expectations. If the number is significantly lower than projected, ramp duration or concurrency configuration may require adjustment.
The p95 latency value shows how the majority of requests behaved during sustained concurrency.
In this example, 95 percent of requests were completed within 285 milliseconds, which remains below the defined threshold of 300 milliseconds.
The p99 latency reveals tail behavior. A large gap between p95 and p99 can indicate occasional resource contention spikes.
The failure rate of 0.45 percent indicates that fewer than one percent of requests resulted in errors.
If this value exceeded the threshold, the test would fail automatically due to the configured performance contract.
The vus_max metric confirms the maximum number of concurrent virtual users that were active during the test. This validates that the ramp reached the intended concurrency levels.
Identify the first resource to saturate
Load testing becomes meaningful when correlated with infrastructure monitoring.
During the 1,000-user phase, if CPU remains at sustained high utilization, database query times steadily increase, connection pools begin hitting their limits, and cache hit ratios decline, the system is signaling resource contention under concurrency.
From an FPP standpoint, rising CPU suggests compute saturation, increasing query duration indicates I/O pressure, connection limits point to configuration ceilings, and declining cache efficiency reveals memory or eviction stress.
Then, latency growth can be mapped to a specific bottleneck.
For example:
If p95 latency rises sharply after 800 concurrent users while CPU usage remains moderate and database query time doubles, the bottleneck is likely database throughput rather than application compute capacity.
If error rates increase with messages such as connection refused, timeout, or too many connections, the system is hitting hard capacity ceilings.
From an FPP perspective, connection refused indicates upstream rejection, timeout reflects queueing or slow dependency response, and too many connections signals exhausted pools or database limits.
In these cases, connection pool configuration or upstream service constraints require adjustment.
Load testing without infrastructure correlation reveals symptoms. Accurate diagnosis depends on cross-layer visibility.
Convert results into capacity estimates
Capacity planning emerges from identifying the concurrency level at which performance thresholds are violated.
Capacity planning begins by identifying the concurrency level at which defined thresholds are breached.
If p95 latency remains under 300ms up to 1,200 users, crosses that boundary at 1,400 users, and error rates exceed one percent at 1,600 users, then the sustainable operating limit under the current architecture sits below 1,400 concurrent users.
From an FPP perspective, the first threshold breach marks the contention boundary, while the error spike marks the saturation boundary. This measured envelope guides scaling strategy, instance sizing, database pool configuration, and caching adjustments with evidence rather than assumptions.
Re-test after optimization
Suppose query indexing reduces database response time by 30 percent. The same load test should be re-executed with an identical ramp configuration.
If the new results show:
p(95)=240ms
error rate=0.2%
At 1,400 concurrent users, the optimization produced a measurable improvement.
Re-running the same script ensures comparability. Changing both infrastructure and traffic patterns at the same time eliminates the ability to isolate cause and effect.
Load testing becomes iterative rather than episodic. Each architectural change should be validated under controlled concurrency.
What prevents API load tests from producing misleading results?
 (1).jpg)
Many load tests fail to reveal real bottlenecks because they model traffic incorrectly or measure too narrowly.
Using small datasets creates false confidence. Query performance and lock behavior change as data volume grows, so tests must reflect production scale.
Testing from a single region hides latency variability. Global traffic introduces network overhead that inflates tail percentiles.
Ignoring edge scenarios, such as large payloads or concurrent heavy writes, masks stress points that rarely appear under average conditions.
Finally, measuring only response time obscures root causes. Correlating latency with CPU, database performance, connection pools, and cache metrics turns surface results into actionable insight.
Accurate load testing is less about generating traffic and more about modeling real-world conditions precisely enough to expose failure before users experience it.
How to decide which tool fits your testing strategy?
Selecting a suitable load testing tool selection depends on what operational question you are trying to answer.
If you need workflow simulation with automated pass-fail thresholds in CI pipelines, virtual user models like k6 provide direct integration advantages.
If your testing team requires visual configuration and detailed GUI-driven reporting, JMeter supports collaborative test plan construction.
If capacity validation requires precise injection control and high concurrency handling, Gatling’s script-driven injection patterns provide fine-grained modeling.
If the objective is measuring raw request-per-second limits for a specific endpoint, rate-based tools like Vegeta offer straightforward execution.
The key consideration is alignment between the traffic model and production behavior. Choosing a tool without understanding how it generates load can distort performance conclusions.
Implementation detail matters because concurrency modeling determines whether the results represent realistic usage or artificial pressure patterns. Competitor content often stops at naming tools.
Effective load testing practice requires understanding the execution model beneath those tools.
Conclusion
Load testing is an essential practice for maintaining a robust and scalable API. By following the steps and best practices outlined in this guide, you can ensure your API performs well under pressure, providing a seamless experience for your users and supporting your business growth.
Remember, load testing is not a one-time activity but an ongoing process. As your API evolves and your user base grows, regular load testing will help you stay ahead of performance issues and deliver a consistently high-quality service.
 WhatsApp
 Call Us
 Mail Us