


Programming with R: Data Types and Structures


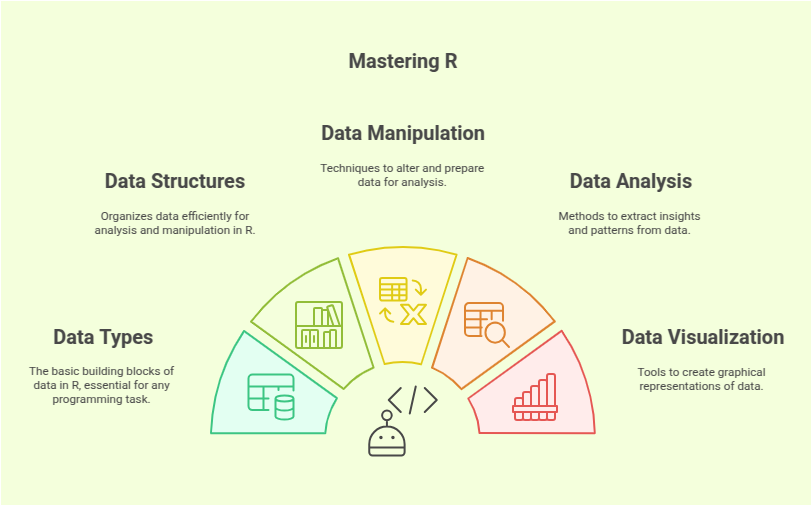
R is one of the most popular programming languages for statistical computing and data analysis. At its core, R provides a rich set of data types and structures that allow users to manipulate, analyze, and visualize data efficiently. Understanding these foundational elements is essential for leveraging the full power of R. In this blog, we’ll explore R’s fundamental data types and structures, providing examples to help you get started.
Data Types in R
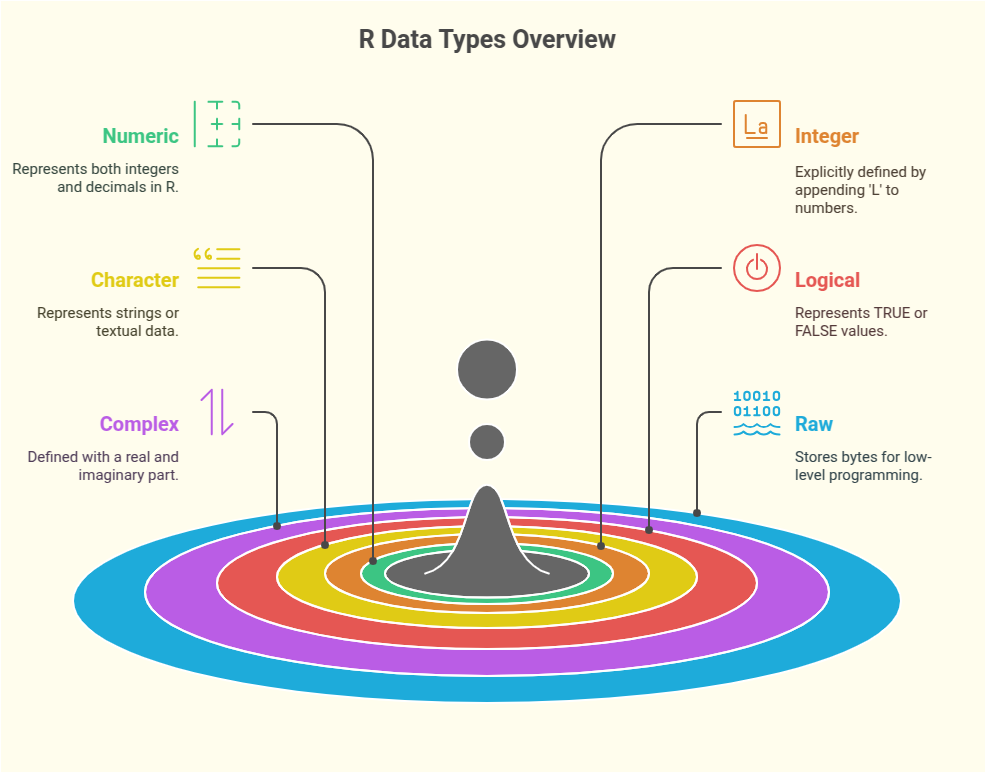
R supports several basic data types that form the building blocks of any analysis. Let’s dive into the primary data types:
Numeric
The default data type for numbers in R is numeric, which can represent both integers and decimals.
Example:
x <- 42     # Numeric integer
y <- 3.14   # Numeric decimal
Integer
Integers are explicitly defined by appending an L to the number.
Example:
z <- 10L    # Integer
class(z)    # Output: "integer"
Character
Strings or textual data are represented as character data.
Example:
name <- "John Doe"
class(name)   # Output: "character"
Logical
Logical values represent TRUE or FALSE.
Example:
is_raining <- TRUE
class(is_raining)   # Output: "logical"
Complex
Complex numbers are defined with a real and imaginary part.
Example:
complex_num <- 2 + 3i
class(complex_num)  # Output: "complex"
Raw
The raw type stores bytes, often used in low-level programming.
raw_data <- charToRaw("Hello")
raw_data
Data Structures in R
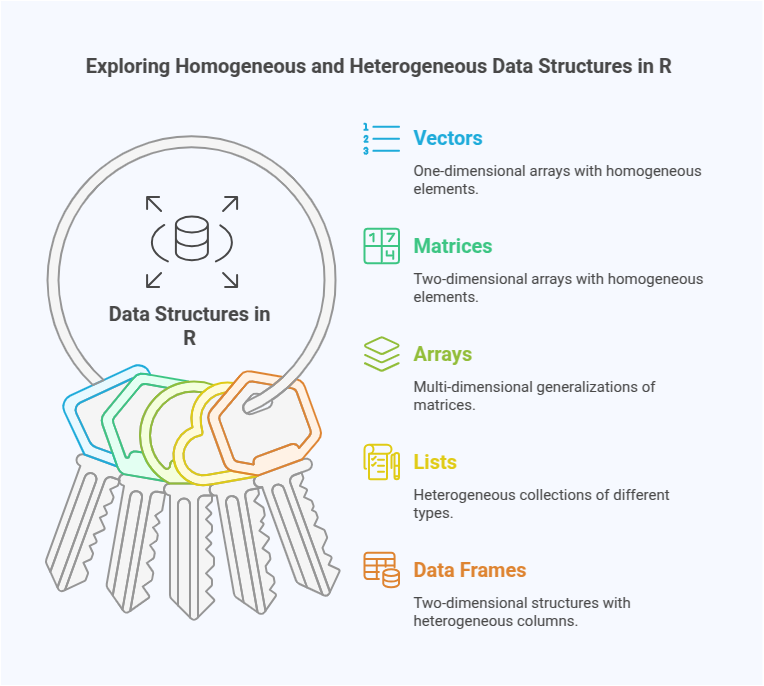
Beyond individual data types, R provides several data structures to organize and manipulate data. These structures can broadly be categorized as homogeneous (containing elements of the same type) and heterogeneous (containing elements of different types).
Vectors (Homogeneous)
A vector is a one-dimensional array that holds elements of the same type.
Example:
# Numeric vector
numbers <- c(1, 2, 3, 4)
# Character vector
fruits <- c("Apple", "Banana", "Cherry")
Matrices (Homogeneous)
A matrix is a two-dimensional array where all elements are of the same type.
Example:
matrix_data <- matrix(1:9, nrow = 3, ncol = 3)
print(matrix_data)
Arrays (Homogeneous)
Arrays are multi-dimensional generalizations of matrices.
Example:
array_data <- array(1:12, dim = c(2, 3, 2))
print(array_data)
Lists (Heterogeneous)
A list can hold elements of different types, making it highly versatile.
Example:
my_list <- list(name = "John", age = 30, scores = c(95, 85, 75))
print(my_list)
Data Frames (Heterogeneous)
A data frame is a two-dimensional structure where each column can have a different type, similar to a table in a database.
Example:
data <- data.frame(
  Name = c("Alice", "Bob"),
  Age = c(25, 30),
  Score = c(90, 85)
)
print(data)
Factors (Categorical)
Factors are used to represent categorical data and can be ordered or unordered.
Example:
gender <- factor(c("Male", "Female", "Male"))
print(gender)
Tibbles
Tibbles are an enhanced version of data frames, provided by the tidyverse package. They are more user-friendly for data manipulation.
Example:
library(tibble)
tibble_data <- tibble(
  Name = c("Eve", "Frank"),
  Age = c(22, 28)
)
print(tibble_data)
Manipulating Data Structures
R offers a wide range of functions to manipulate data structures. Here are a few examples:
Selecting Elements
# Vectors
fruits <- c("Apple", "Banana", "Cherry")
print(fruits[2])   # Output: "Banana"

# Data Frames
print(data$Name)   # Select the 'Name' column
print(data[1, 2])  # Select the element in the first row, second column
Adding Elements
# Adding to a vector
numbers <- c(1, 2, 3)
numbers <- c(numbers, 4)

# Adding a column to a data frame
data$Passed <- c(TRUE, FALSE)
print(data)
Filtering Data
# Filtering rows in a data frame
filtered_data <- data[data$Age > 25, ]
print(filtered_data)
Use Cases for R Language
The R programming language is widely used in data analysis, statistics, machine learning, and visualization. Here are some key use cases of R:
1. Data Science & Analytics
- Data Wrangling: Cleaning and transforming raw data using
dplyr,tidyr, anddata.table. - Exploratory Data Analysis (EDA): Summarizing datasets with
ggplot2,summary(), andhist(). - Statistical Analysis: Running descriptive and inferential statistics.
2. Machine Learning & AI
- Supervised Learning: Regression (
lm()), classification (caret,randomForest). - Unsupervised Learning: Clustering (
kmeans,hclust), dimensionality reduction (PCA). - Deep Learning: Integration with TensorFlow/Keras (
tensorflow,keraspackages).
3. Financial Analysis & Quantitative Trading
- Stock Market Analysis: Time series forecasting (
forecast,prophet). - Portfolio Optimization: Risk analysis (
quantmod,TTR). - Algorithmic Trading: Backtesting strategies.
IDEs for R language
There are several Integrated Development Environments (IDEs) available for R programming, each catering to different needs. Here are some of the best IDEs for R:
1. RStudio (Most Popular)
Best for: Data Science, Machine Learning, and General R Development
- User-friendly interface with script, console, environment, and plots panes
- Built-in support for debugging, version control, and package management
- Advanced visualization tools (
ggplot2,plotly) Supports Shiny for web apps and R Markdown for reports - Works with R and Python
2. Jupyter Notebook (For R & Python)
Best for: Interactive Data Science and Machine Learning
Supports R kernel (IRKernel) for writing R code in Jupyter
Excellent for data visualization and exploratory analysis
Works with Python, Julia, and R
Allows running code, markdown, and visualizations in the same notebook
Install R Kernel for Jupyter:
install.packages("IRkernel")
IRkernel::installspec(user = TRUE)
3. Visual Studio Code (VS Code)
Best for: R Development with Extensions Requires R extension for syntax highlighting and execution Integrated Terminal & Git Support Lightweight and customizable with extensions Works with multiple languages
Extensions:
- Install the R extension (
R Language Support) - Install R LSP Client for better auto-completion
Download: https://code.visualstudio.com/
Conclusion
R’s rich set of data types and structures enables users to handle complex datasets effectively. Whether you’re performing statistical analysis, data visualization, or machine learning, understanding these building blocks is crucial for writing efficient R code. By mastering these basics, you’ll be well-equipped to tackle more advanced concepts and workflows in R.
Happy coding with R!
 WhatsApp
 Call Us
 Mail Us