Best Debugging & Monitoring Tools for Python Programming
What are Debugging and Monitoring Tools?
Debugging Tools:
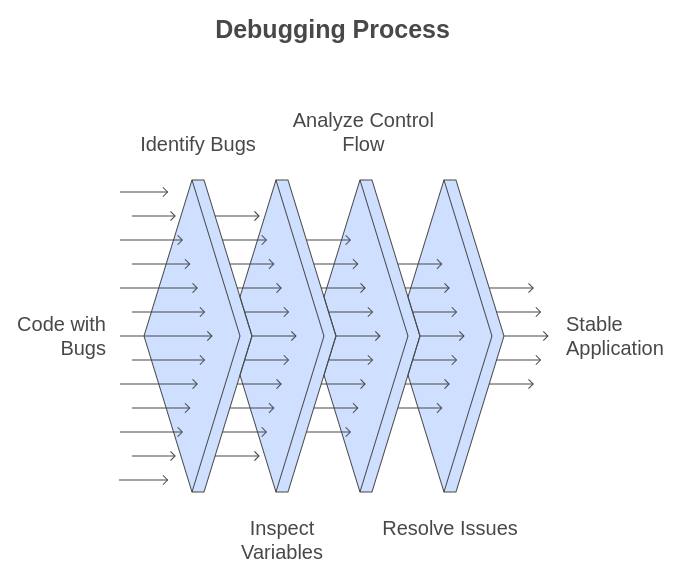
Debugging tools are software applications that help developers identify and fix bugs in their code. These tools enable interactive debugging, allowing developers to step through their code, inspect variables, and analyze the control flow.
By using debugging tools, developers can quickly locate and resolve issues, enhancing code quality and reliability, ultimately leading to more stable and efficient applications.

Monitoring Tools:
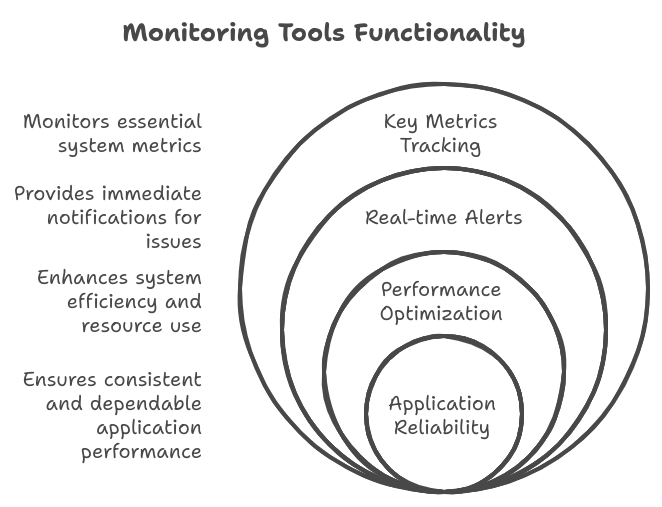
Monitoring tools are essential for tracking the performance and health of applications and infrastructure in real time. These tools provide insights into key metrics such as response times, resource utilization (CPU, memory), and error rates.
With real-time alerts, monitoring tools notify developers of potential issues, enabling quick responses. By implementing these tools, organizations can maintain application reliability, optimize performance, and ensure a smooth user experience.

Why Use Debugging and Monitoring Tools?
Debugging and monitoring tools are vital for developers to ensure their applications run smoothly and efficiently. Let’s explore their importance using a real-world example.
Scenario:
Imagine a team developing a web application for an e-commerce platform. As the launch date approaches, they notice that the application frequently crashes during high-traffic periods, especially during sales events. This not only frustrates users but also results in potential revenue loss.
To address these issues, the team uses debugging tools to identify the root causes of the crashes. By stepping through the code and analyzing the execution flow, they discover that a particular function fails to handle concurrent user requests properly, leading to system crashes. Armed with this knowledge, they implement fixes, such as adding proper error handling and optimizing the code for better concurrency.
Once the application is live, the team integrates monitoring tools to track the application’s performance in real time. These tools provide valuable insights into metrics such as response times, error rates, and server load. When a spike in traffic occurs during a flash sale, the monitoring tools alert the team to increased response times and potential bottlenecks. This enables them to react quickly, optimizing database queries and scaling resources as needed to maintain performance.
By utilizing both debugging and monitoring tools, the development team can resolve issues effectively and ensure that the application remains stable and responsive under high traffic. This dual approach enhances user satisfaction, minimizes downtime, and ultimately contributes to the platform's success during critical sales events.
Top Debugging Tools for Python

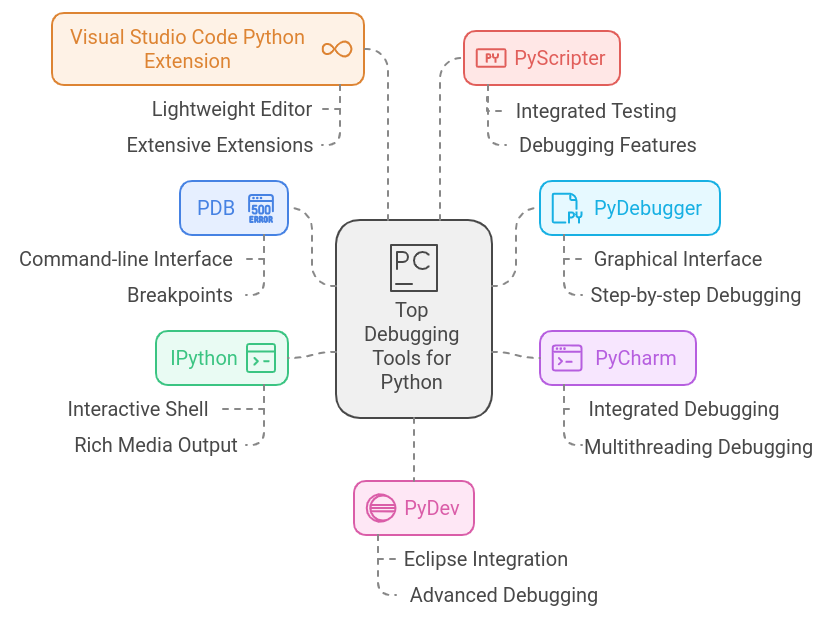
PDB
PDB, the built-in Python debugger, is a powerful tool that provides developers with an interactive debugging experience. It allows you to pause your program’s execution and inspect its state, making it easier to understand what’s happening at any point in time. With PDB, you can set breakpoints, step through your code line by line, and evaluate variables in real-time.
To get started with PDB, simply insert the following line in your code where you want to begin debugging:
import pdb;

pdb.set_trace()
This will pause the execution and give you access to the PDB command-line interface.
Here are some useful commands you can use in PDB:
n(next): Execute the next line of code.c(continue): Continue execution until the next breakpoint.s(step): Step into a function call.p variable_name: Print the value of the specified variable.q(quit): Exit the debugger.
You can add PDB to debug a function in a single line by using the pdb.set_trace() method. Here’s how you can do it:
import pdb

def add(a, b):
    answer = a+b
    return answer

pdb.set_trace()
sum = add(1,2)
print(sum)
Key Features:
PyDebugger
PyDebugger is a third-party tool designed to offer a more visual and user-friendly debugging experience compared to Python’s built-in PDB. PyDebugger is especially useful for developers who prefer a graphical interface over a command-line experience. By integrating easily with Python, it simplifies the process of identifying, inspecting, and fixing bugs in real time.
Example
from pydebugger.debug import debug

debug(variable1="data1", debug=True)
output :
$ python debugger.py
2024:10:22~12:09:18:573544 debugger.py -> variable1: data1 -> TYPE:<class 'str'> -> LEN:5 -> [debugger.py:debugger.py] [3] PID:60855
Key Features
PyCharm
PyCharm is a powerful Integrated Development Environment (IDE) that provides a robust debugging experience for Python developers. Its debugger is seamlessly integrated into the IDE, allowing users to set breakpoints directly in their code with ease. This feature enables developers to pause execution at critical points, inspect variable values, and evaluate expressions in real time.
One of PyCharm’s standout features is its support for conditional breakpoints, where execution will only pause if specified conditions are met, making it easier to troubleshoot complex logic. The "Smart Step Into" functionality allows developers to navigate through multiple function calls intuitively, focusing on the specific functions of interest.
Key Features:
IPython
IPython is an enhanced interactive shell for Python that offers powerful features for debugging and data exploration. It provides a robust environment for interactive computing and can significantly enhance the debugging experience for developers. With its rich toolkit, IPython allows users to execute code snippets and visualize outputs in real-time, making it an excellent choice for both learning and development.
IPython supports a variety of debugging techniques, including the use of magic commands like %debug, which provides a post-mortem debugging interface after an exception occurs. This command allows developers to inspect the stack frame and evaluate variables at the time of the error, making it easier to identify issues.
Additionally, IPython integrates well with Jupyter notebooks, enabling users to mix code execution with rich text documentation and visualizations. This feature is particularly useful for data science and exploratory programming, allowing for a more comprehensive understanding of code behavior.
Key Features:
%debugVisual Studio Code Python Extension
The Visual Studio Code (VS Code) Python Extension is a powerful tool that enhances the development experience for Python programmers. It provides a comprehensive set of features specifically designed to streamline coding, debugging, and testing workflows. One of its most notable features is the integrated debugger, which allows developers to easily set breakpoints, inspect variables, and control the execution flow of their applications.
The extension supports various debugging configurations, enabling users to run and debug different types of Python applications, including scripts, web applications, and unit tests. With features like the Debug Console, developers can evaluate expressions and interact with their code while it's running, making it easier to diagnose and fix issues on the fly.
Additionally, VS Code's Python extension includes support for debugging frameworks like Flask and Django, providing a seamless experience for web developers. It also offers features like Jupyter Notebook support, which allows developers to run cells interactively while debugging.
Key Features:
PyScripter
PyScripter is a specialized Integrated Development Environment (IDE) designed specifically for Python programming, offering a streamlined and efficient debugging experience. Its lightweight nature makes it an attractive choice for developers who prefer a simple interface without the overhead of larger IDEs.
The integrated debugger in PyScripter is robust and user-friendly, providing essential debugging functionalities such as breakpoints, step execution, and watch expressions. Developers can easily set breakpoints by clicking in the margin of the code editor, allowing them to pause execution at critical points and inspect variable values.
One of the unique features of PyScripter is its ability to evaluate expressions on the fly while debugging, enabling developers to assess the state of their code dynamically. This feature, combined with the "Debugging Console," allows for interactive exploration and immediate feedback during the debugging process.
Key Features:
PyDev
PyDev is a powerful IDE for Python development that integrates seamlessly with Eclipse, providing a rich set of debugging features tailored for developers. It is especially beneficial for those working on Django applications, as it includes specific debugging capabilities for this framework.
The integrated debugger in PyDev stands out for its user-friendly interface and robust functionality. It supports multi-threaded debugging, allowing developers to monitor and troubleshoot issues across multiple threads simultaneously, which is crucial for applications that rely on concurrency. Additionally, PyDev offers remote debugging, enabling users to connect to and debug applications running on remote servers, thus facilitating effective troubleshooting in distributed environments.
For web developers, PyDev includes specialized tools for debugging Django applications, helping to streamline the process of identifying and resolving framework-specific issues. Its integration within the Eclipse ecosystem means that developers can take advantage of a wide range of additional plugins, further enhancing the debugging experience.
Key Features:
Top Monitoring Tools for Python

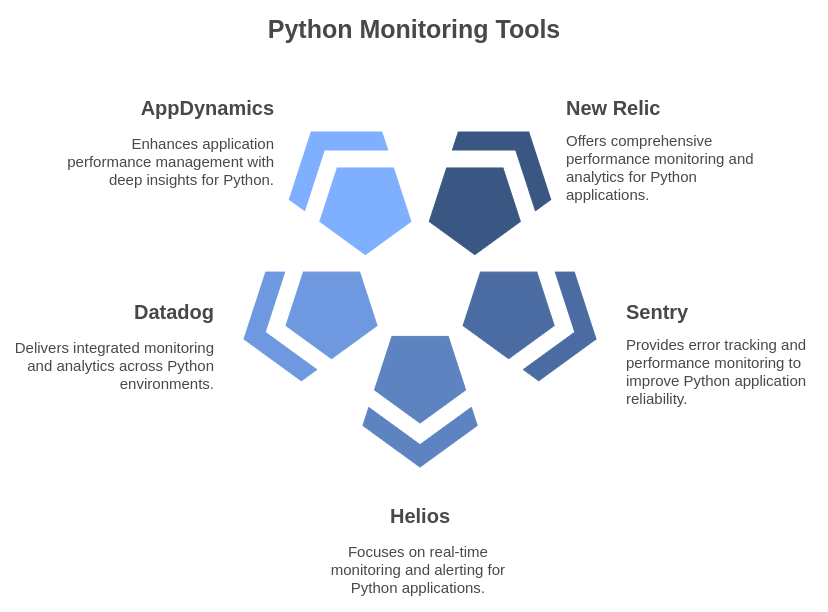
New Relic
New Relic is a cloud-based observability platform designed to help developers, IT operations, and business leaders monitor and improve the performance of their applications and infrastructure. It provides a suite of tools that offer real-time insights into how applications are performing, user interactions, and overall system health.
Key Features:
- Application Performance Monitoring (APM)
- Infrastructure Monitoring
- Real User Monitoring (RUM)
- Distributed Tracing
- Dashboards and Reporting
- Alerts and Notifications
Sentry
Sentry is an open-source application monitoring and error tracking tool designed to help developers identify and resolve issues in real-time. By capturing errors and performance data, Sentry provides valuable insights into application behavior, enabling teams to improve the overall user experience.
With its ability to track errors across various platforms and languages, Sentry integrates seamlessly into existing development workflows. The tool offers detailed contextual information for each error, including stack traces, user interactions, and device data, which aids in quick troubleshooting.
Sentry also features performance monitoring capabilities, allowing teams to identify slow transactions and optimize application performance. Real-time alerts keep developers informed about issues as they arise, enabling proactive resolution. By providing user feedback and supporting release management, Sentry enhances collaboration and accountability within development teams, ultimately leading to more stable and reliable applications.
Key Features:
- Performance Monitoring
- Real-Time Alerts
- Detailed Contextual Information
- Release Management
- User Feedback
- Integration with Development Tools
- Support for Multiple Languages and Frameworks
Helios
Helios is a powerful monitoring and observability tool specifically designed for modern cloud-native applications. It offers a comprehensive solution for tracking performance, diagnosing issues, and managing application health in real time. Helios integrates seamlessly with various cloud platforms and microservices architectures, providing developers with the necessary insights to optimize performance and enhance user experience.
The tool focuses on simplifying complex monitoring tasks, allowing teams to visualize metrics, logs, and traces in a unified dashboard. With features like automated alerting and anomaly detection, Helios enables proactive issue resolution, reducing downtime and improving application reliability. It supports multiple programming languages and frameworks, making it adaptable to diverse tech stacks. Helios fosters collaboration among development, operations, and business teams, empowering them to work together efficiently. By leveraging Helios, organizations can ensure that their applications run smoothly, delivering exceptional performance and user satisfaction.
Key Features:
- Real-Time Monitoring
- Automated Alerting
- Anomaly Detection
- Unified Dashboards
- Log Management
- Distributed Tracing
- Integrations with Cloud Platforms
- Support for Multiple Languages and Frameworks
Datadog
Datadog is a comprehensive cloud monitoring and analytics platform that provides visibility into the performance of applications, infrastructure, and logs. Designed for modern DevOps environments, Datadog enables organizations to monitor cloud-scale applications in real-time, ensuring optimal performance and reliability.
With its robust suite of monitoring tools, Datadog offers end-to-end visibility across various components of the technology stack, including servers, databases, and services. The platform integrates seamlessly with popular cloud providers and frameworks, making it adaptable to diverse environments. Users can create customizable dashboards to visualize key metrics, set alerts for proactive incident management, and utilize advanced analytics to troubleshoot issues efficiently.
Datadog’s distributed tracing and APM (Application Performance Monitoring) features allow teams to pinpoint latency and performance bottlenecks in their applications. By leveraging Datadog, organizations can enhance collaboration between development and operations teams, ultimately leading to improved application performance and user satisfaction.
Key Features:
- Infrastructure Monitoring
- Application Performance Monitoring (APM)
- Log Management
- Real-Time Analytics
- Customizable Dashboards
- Distributed Tracing
- Alerts and Notifications
- Integration with Cloud Services
AppDynamics
AppDynamics is a leading application performance monitoring (APM) solution that provides deep insights into application performance, user experiences, and business outcomes. Designed for complex, cloud-native environments, AppDynamics enables organizations to monitor the entire application lifecycle, from the front end to the back end.
The platform offers real-time visibility into application performance metrics, allowing teams to identify and troubleshoot performance bottlenecks effectively. With its powerful transaction tracing capabilities, AppDynamics provides detailed insights into the flow of requests through microservices architectures, helping developers understand how different components interact.
Key Features:
- Application Performance Monitoring (APM)
- Real-Time Analytics
- Transaction Tracing
- User Experience Monitoring
- Infrastructure Monitoring
- Business Performance Monitoring
- Automated Alerts
- Integrations with DevOps Tools
Conclusion
In the fast-paced world of software development, especially within the Python ecosystem, the importance of debugging and monitoring tools cannot be overstated. These tools not only enhance the quality of code but also ensure that Python applications perform optimally under varying conditions. By leveraging effective debugging tools, developers can quickly identify and resolve issues, leading to cleaner and more reliable Python code. Monitoring tools, on the other hand, provide crucial insights into application performance and health, enabling teams to respond proactively to potential problems before they impact users.
The real-world scenario of an e-commerce platform highlighted how the integration of both debugging and monitoring tools can significantly improve application stability and user satisfaction, especially during critical times like sales events. As organizations continue to embrace complex architectures and cloud-native environments, having the right set of debugging and monitoring tools specifically designed for Python will be essential for maintaining robust application performance.
By investing in these tools, Python developers can foster a culture of continuous improvement, ensuring that their applications not only meet user expectations but also adapt to the ever-changing technological landscape. Ultimately, the combination of proactive monitoring and effective debugging strategies will empower teams to deliver high-quality Python applications that drive business success and enhance user experiences.
