


R vs Python: Which Programming Language Should You Choose?
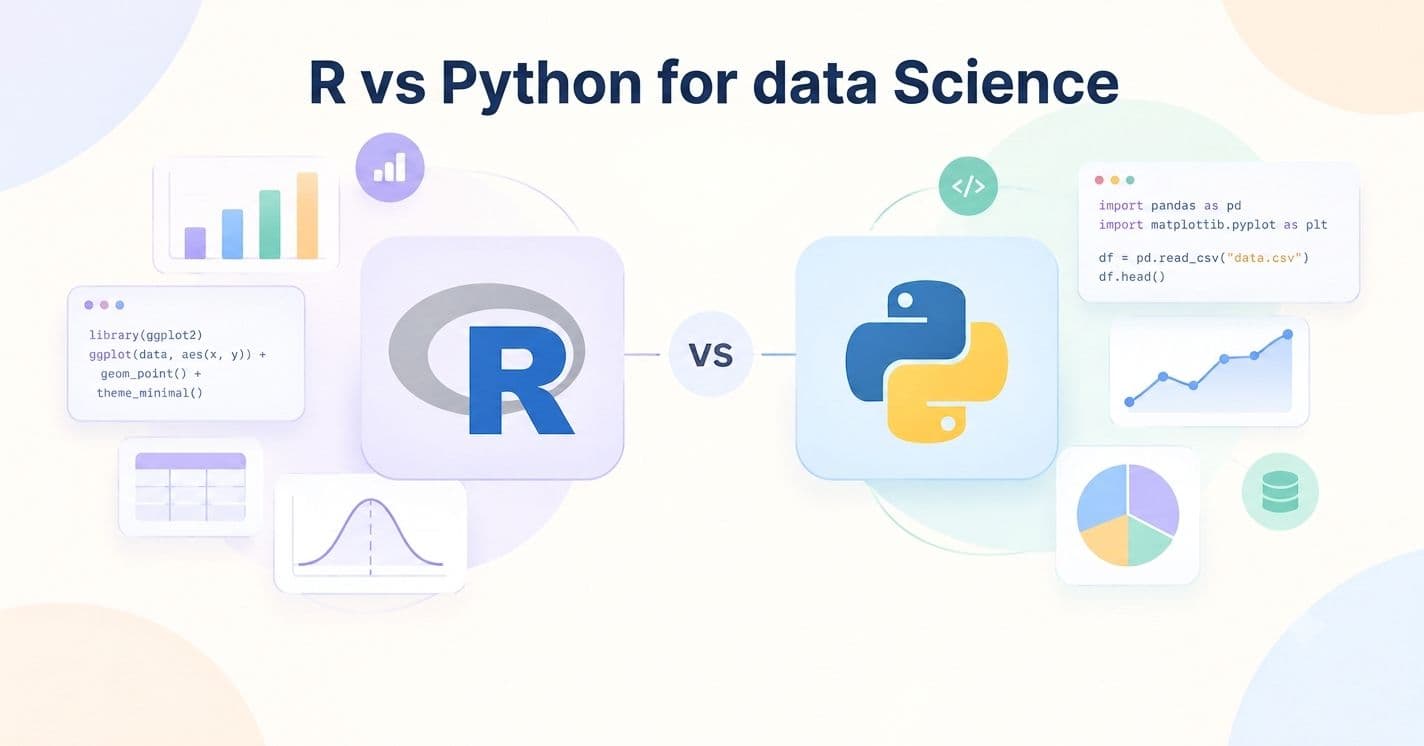



R and Python are two widely used programming languages for data science, but they serve different purposes. R is mainly focused on statistics, data analysis, and visualisation, while Python offers a broader range of applications, including data science, machine learning, automation, and software development. Both have strong libraries and tools for working with data, but their features, learning curves, performance, and common use cases differ.
So, R vs Python: which one should you choose? The answer depends on your project requirements, technical goals, and the type of work you want to do. This guide compares R and Python across their features, ecosystems, performance, use cases, ease of learning, and career opportunities to help you understand which language fits your ne
What Is R?
R is an open‑source programming language and software environment that is mainly built for statistics, data analysis, data visualisation, and statistical computing. R gives users a range of built‑in functions and packages that help R work with datasets, examine relationships between variables, spot patterns, run statistical tests, and show results with charts and graphs. R is widely used by statisticians, data scientists, researchers, analysts, and professionals who work with data.
R’s key strength is its set of packages for statistical analysis and data visualisation. Packages such as ggplot2 give R tools for creating customised charts, while dplyr helps R clean, filter, organise and transform datasets. Other packages support areas such as regression, forecasting, machine learning, time‑series analysis, and specialised research. R also works well with tools such as RStudio, R Markdown and Quarto, which support coding, analysis, visualisation and reporting within the workflow.
R is especially useful for projects where statistical analysis and data exploration are central requirements. For example, researchers can use R to analyse results, analysts can use R to examine trends in business data, and statisticians can use R to build models that reveal relationships within datasets. . R’s global data community, combined with its visualisation and reporting capabilities, makes R a practical choice for research and data-focused work.
What Is Python?
Python is a general-purpose programming language that is famous for its simple way of writing code, easy-to-understand structure, and many different uses. It is one of the most popular programming languages and works well for people who are just starting out as well as those who have a lot of experience. The reason is that the code in Python is easy to read, write, and keep up with over time.
Python is used in different areas like building websites, looking at data, making machines learn, creating smart systems, making tasks automatic, developing software, and doing AI and data science. It has a collection of tools and structures that help programmers create programs and do hard jobs without having to build everything from the beginning. For example, Pandas and NumPy are often used for working with data, while Scikit-learn, TensorFlow, and PyTorch help with making machines learn and creating systems.
Another key thing about Python is that it can be used in different ways. It works for tasks like processing data and also for big projects like making large software. The detailed guides, the people who work with Python, and the many extra tools available help a lot when learning, building, and solving problems. These things make Python a good choice for different kinds of technical work.
How Widely Are R and Python Used?
These three figures give a quick look at how R and Python compare in adoption, usage, and popularity.
What Is the Difference Between R and Python?
R and Python can both be used for data analysis, visualisation, and machine learning. R and Python have different strengths. R is mainly focused on statistics and data analysis. R is well known for its tools. Python is a general‑purpose programming language that is used across software development, automation, AI, web development, and data science.

What Are the Strengths of R?
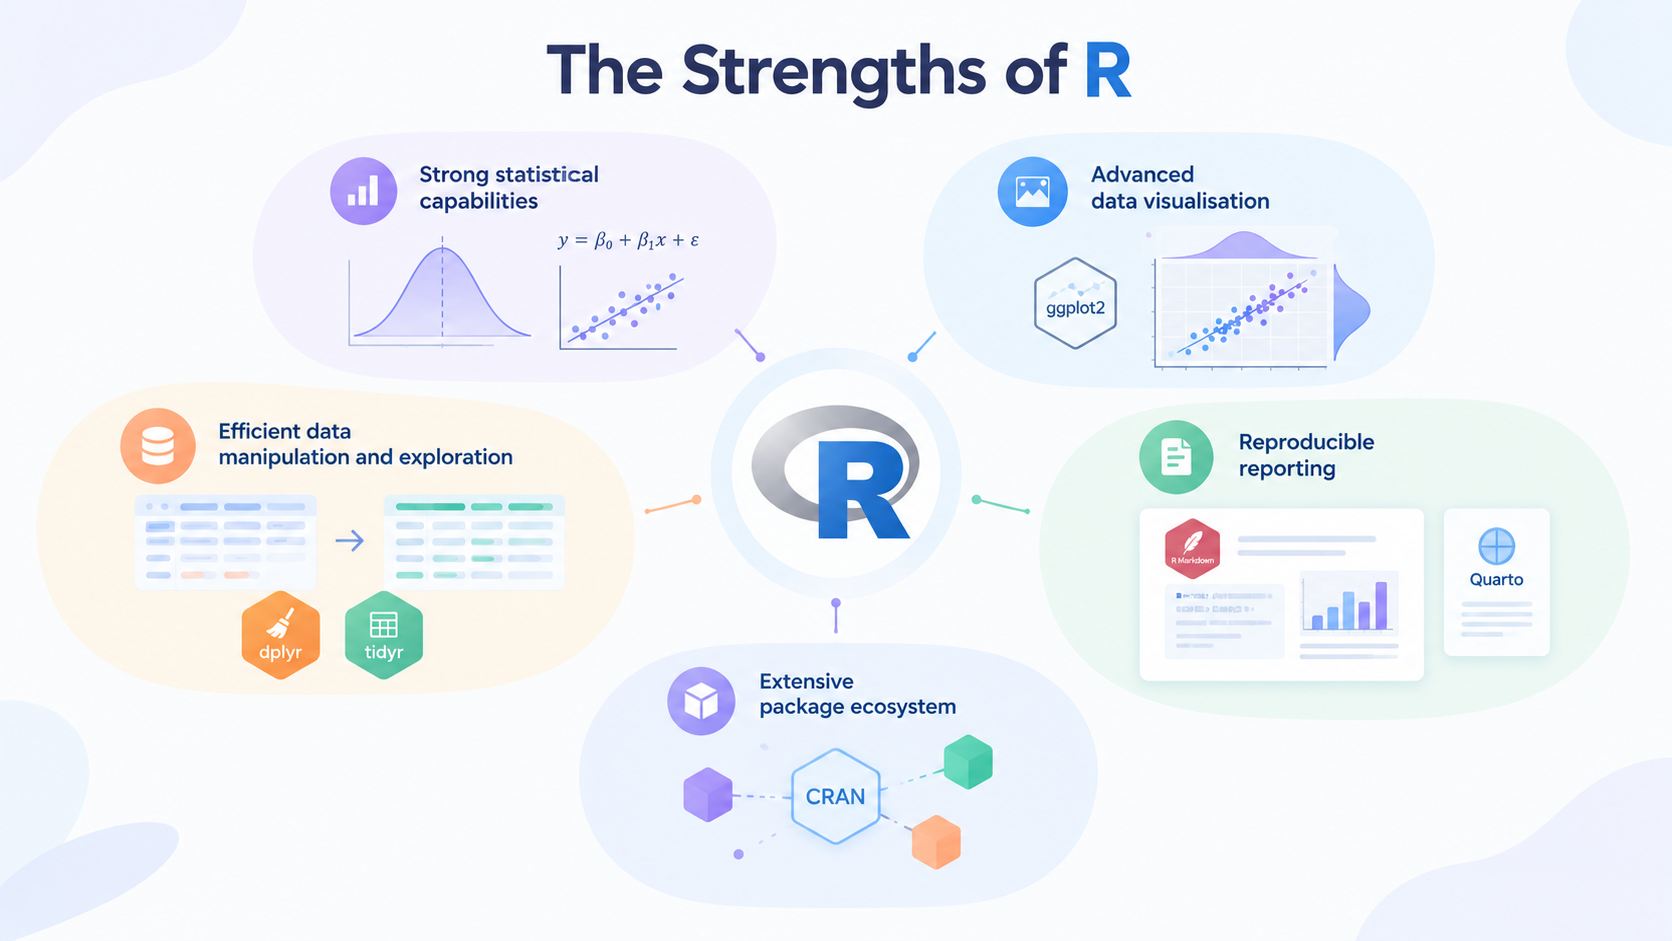
R is mainly made for doing statistics, studying data, and creating pictures from data. This gives R an advantage when you need to explore, understand, and show data. R has a set of packages that give you special tools for statistics, data cleaning, pictures, models, and reports. R is especially useful when the main aim is to understand data, do analysis, and explain results clearly.
1. Strong Statistical Capabilities
Statistics is one of R's strengths. R comes with built-in functions and special packages for statistical methods, such as regression, hypothesis testing, correlation, probability distributions, time‑series analysis, and statistical modelling. Users can do complex statistical analysis without having to create these methods from the beginning.
R also makes it easier to use statistical techniques through its package set. This helps analysts, researchers, and other professionals who work with data sets and need to use proven statistical methods. For projects where statistical analysis is a big part of the work, R gives a wide range of tools all in the same place.
2. Advanced Data Visualisation
R focuses a lot on turning data into helpful pictures. The ggplot2 package is one of the popular tools in the R world and lets users build charts by mixing data, visual parts, and custom options. You can use ggplot2 to make bar charts, line graphs, scatter plots, box plots, histograms, and many other kinds of pictures.
The R graphics package also lets you change charts to fit the needs of an analysis or report. Users can adjust parts like labels, scales, themes, colours and layouts. This makes R handy when showing results with pictures.
3. Efficient Data Manipulation and Exploration
Before analysis starts, data sets usually need cleaning, filtering, changing, and sorting. R gives packages like dplyr and tidyr for these jobs. These packages let users pick columns, filter rows, make variables, group information, summarise data sets, and reshape data into new forms.
These tools also help with exploratory data analysis (EDA), where users look at a data set to see how it is built, spot patterns, find values, and check links between variables. Using data cleaning and visualisation tools together lets many of these steps happen in the R workflow.
4. Reproducible Reporting
Another point of R is that it can mix analysis with writing. Tools like R Markdown and Quarto let users put R code, explanations, tables, charts, and results in one document. When the data or code changes, the analysis and output can be recreated by updating each result by hand.
This is very useful for research reports, analysis papers, academic work, and other cases where the work must be written down clearly. Keeping code and results together also helps others see how the final findings were made.
5. Extensive Package Ecosystem
R has a set of packages that add to what R can do beyond the basic functions. CRAN (Comprehensive R Archive Network) offers thousands of packages that cover areas like statistics, data cleaning, pictures, machine learning, time‑series analysis, and specific research methods.
This means users can often find a package that meets a need instead of writing every function by hand. Packages like ggplot2, dplyr, tidyr, and tidymodels are part of a set that helps with different steps of working with data.
Overall, R's strengths come from statistics, graphical power, data cleaning tools, repeatable reports, and a special package set. R is especially good for projects where studying data using methods and showing results are the main needs.
Where Is R Used?
R is used across fields where statistical analysis, data interpretation, and research are important. Its specialised statistical tools and large package ecosystem make it suitable for working with datasets, building statistical models, and presenting analytical results. Its use extends beyond a single industry, with applications across academic research, healthcare, finance, government, and business.
1. Academic and Scientific Research
R is widely used in academic and scientific research for analysing experimental data, testing hypotheses, and creating statistical models. Researchers can use R to examine relationships between variables, analyse survey results, and produce charts and reports for research papers. Its support for reproducible analysis also helps researchers document how their results were generated.
2. Healthcare and Biostatistics
In healthcare and biostatistics, R is used to analyse clinical and population-level data. Researchers can use it to study treatment outcomes, analyse clinical trial data, examine disease patterns, and perform survival analysis. For example, a research team may use R to compare outcomes across different treatment groups and present the results through statistical models and visualisations.
3. Finance and Economics
R is used in finance and economics for analysing financial data, studying market trends, and developing statistical and forecasting models. Financial analysts and economists can use R to examine historical data, measure risk, and evaluate economic indicators. Its statistical capabilities are useful when financial decisions depend on analysing large datasets and identifying patterns.
4. Government and Public Policy
Government organisations and public-sector researchers can use R to analyse population, economic, social, and environmental data. It can support tasks such as analysing census information, studying employment trends, evaluating survey results, and preparing reports. R's statistical and visualisation tools can help turn large public datasets into findings that are easier to interpret.
5. Business and Market Research
R is also used in business and market research to analyse customer surveys, study consumer behaviour, and examine business data. For example, a research team may use R to analyse survey responses and identify differences between customer groups. The results can then be presented through charts and statistical summaries to support business research and planning.
Overall, R is commonly found in research-focused and statistics-heavy fields, particularly where analysing data and communicating statistical findings are central to the work. This makes its applications especially relevant to organisations working with research, healthcare, finance, economics, and other data-intensive areas.
What Are the Strengths of Python?
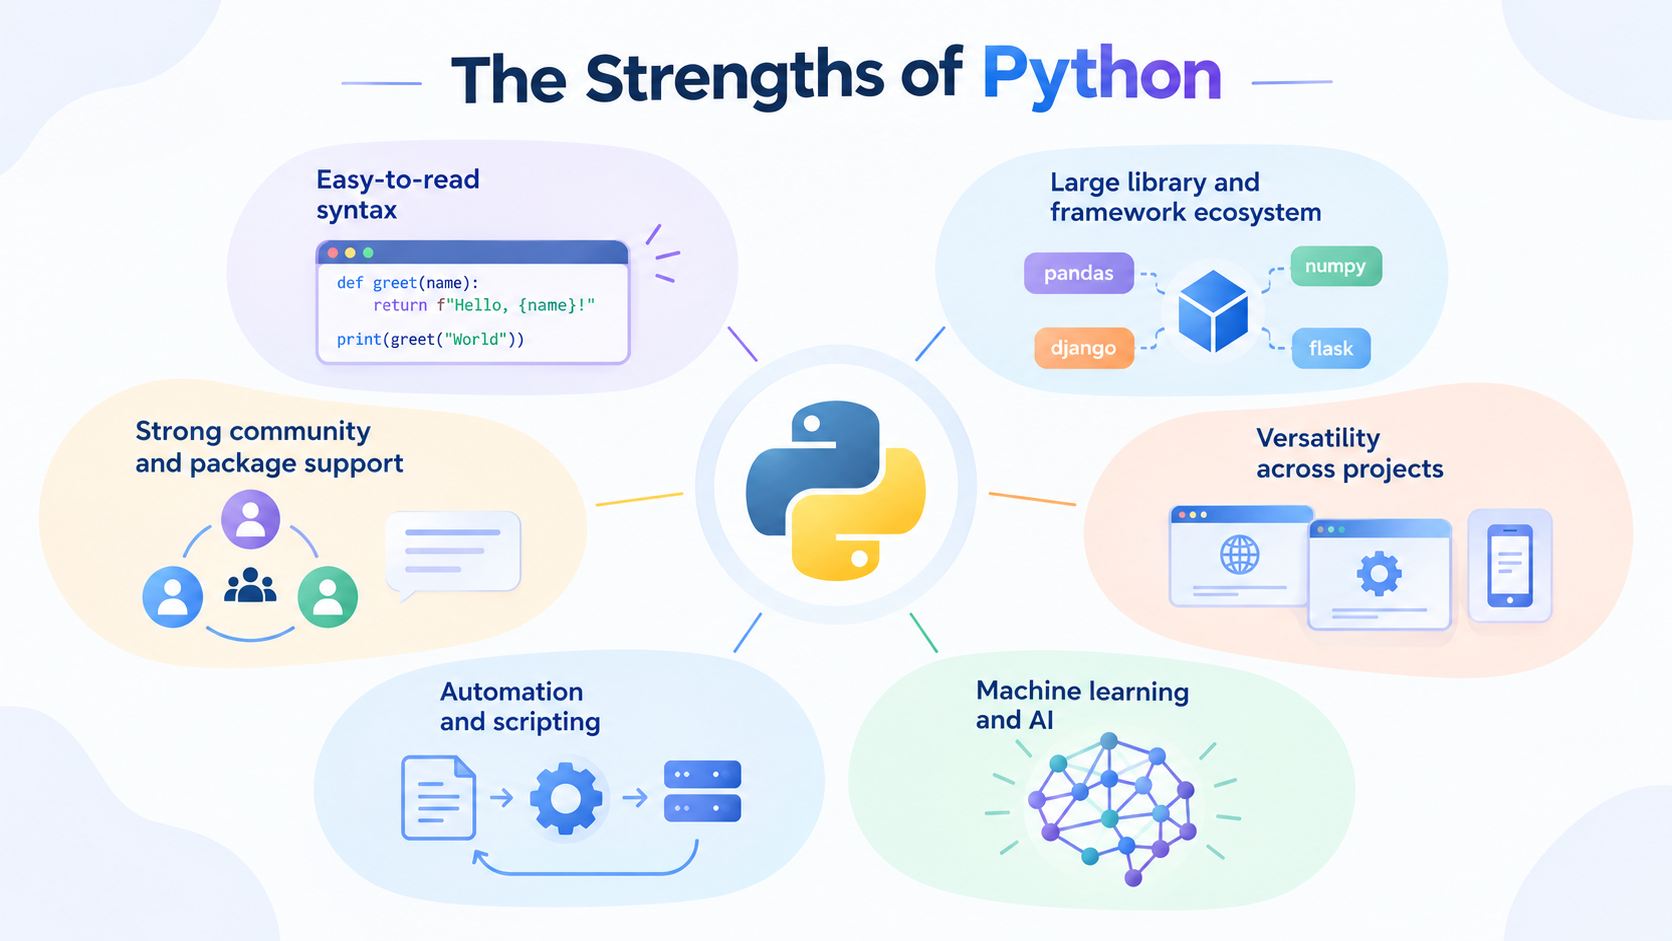
Python is a versatile programming language known for its readable syntax, large ecosystem, and wide range of applications. It provides tools for data analysis, machine learning, automation, web development, scientific computing, and general software development. Its simple syntax and extensive collection of libraries also make it accessible to beginners while providing enough functionality for more advanced projects.
1. Easy-to-Read Syntax
One of Python's biggest strengths is its simple and readable syntax. Python code is designed to be relatively easy to understand, which can make it easier for beginners to learn programming concepts and start building projects.
The language uses fewer symbols and less complex syntax compared with many other programming languages. This can also make existing code easier to read and maintain, especially when several developers are working on the same project.
2. Large Library and Framework Ecosystem
Python has a large ecosystem of libraries and frameworks that extend what the language can do. Libraries such as NumPy and Pandas support numerical computing and data manipulation, while Matplotlib and Seaborn are commonly used for data visualisation.
Python also provides tools for machine learning and artificial intelligence through libraries and frameworks such as Scikit-learn, TensorFlow, and PyTorch. Web frameworks such as Django and Flask support application development, while other libraries provide tools for automation, testing, scientific computing, and many other tasks.
3. Versatile for Different Projects
Python can be used across different types of technical projects instead of being limited to one particular area. The same language can be used to analyse data, automate repetitive tasks, build web applications, develop machine learning models, and create software tools.
This versatility can be useful for developers and teams working on projects that involve multiple technologies. They can use Python across different stages of development rather than switching to a completely different language for every task.
4. Strong Support for Machine Learning and AI
Python has a strong ecosystem for machine learning and artificial intelligence. Libraries such as Scikit-learn provide tools for common machine learning tasks, while TensorFlow and PyTorch support more advanced model development and deep learning.
Python's libraries make it possible to handle different stages of an AI project, including preparing datasets, training models, evaluating results, and experimenting with different approaches. This makes Python a common choice for projects involving machine learning and AI.
5. Automation and Scripting
Python is well suited to automation because it can be used to create scripts that handle repetitive tasks. Developers can use Python to process files, work with datasets, interact with APIs, generate reports, automate testing, and perform other routine operations.
For example, instead of manually processing hundreds of files, a Python script can be written to read, organise, rename, or transform them automatically. This can reduce repetitive manual work and make routine processes easier to manage.
6. Strong Community and Package Support
Python has a large developer community and an extensive collection of publicly available packages. PyPI (Python Package Index) provides access to thousands of packages that developers can install and use in their projects.
The large community also means developers can find documentation, tutorials, learning resources, and discussions covering many Python-related problems. This support can make it easier to learn the language, troubleshoot issues, and find existing solutions instead of building everything from scratch.
Overall, Python's main strengths come from its readable syntax, broad ecosystem, versatility, machine learning support, automation capabilities, and large community. It is particularly suitable when a project requires a language that can handle different technical tasks within the same development environment.
Where Is Python Used?
Python is used across a wide range of industries because it can support different types of technical work. Unlike languages that are mainly focused on one area, Python is used for software development, artificial intelligence, automation, scientific computing, web applications, and data-related projects. Its libraries and frameworks allow developers and organisations to adapt it to different project requirements.
1. Web Development
Python is used to build websites, web applications, and backend systems. Frameworks such as Django and Flask provide tools for handling application logic, databases, user requests, authentication, and other backend functions.
For example, an online platform can use Python on its backend to process user requests, manage account information, connect with databases, and deliver content to users.
2. Artificial Intelligence and Machine Learning
Python is widely used for artificial intelligence and machine learning projects. Developers and researchers use libraries such as Scikit-learn, TensorFlow, and PyTorch to build, train, and evaluate machine learning models.
Python can be used for applications such as recommendation systems, image recognition, natural language processing, predictive models, and other AI-based solutions. Its ecosystem provides tools for preparing data, developing models, testing them, and analysing their results.
3. Automation and Scripting
Python is commonly used to automate repetitive tasks that would otherwise require manual work. Businesses and technical teams can create Python scripts to process files, generate reports, organise information, interact with APIs, or perform routine system tasks.
For example, a company could use a Python script to collect information from multiple files, organise the data, and generate a report automatically instead of completing each step manually.
4. Scientific Computing and Research
Python is used in scientific research and engineering for numerical calculations, simulations, data analysis, and experimentation. Libraries such as NumPy, SciPy, and Matplotlib provide tools for mathematical operations, scientific calculations, and visualising research data.
Researchers can use Python to analyse experimental results, simulate scientific processes, process large datasets, and create visual representations of their findings.
5. Business and Software Applications
Python is also used to develop internal business tools, desktop applications, backend services, and software solutions. Organisations can use it to build systems for managing information, processing data, connecting different services, or supporting internal workflows.
For example, a business might develop a Python-based internal tool that processes operational data and generates reports for different departments.
6. Data Analysis and Data Engineering
Python is used for analysing, cleaning, transforming, and processing datasets. Libraries such as Pandas and NumPy provide tools for working with structured data, while other Python libraries support database connections, data processing, and visualisation.
Python is also used in data engineering workflows to move and transform data between different systems. This makes it useful when projects involve large amounts of data that need to be prepared before analysis or used by other applications.
Overall, Python is used in fields ranging from web development and AI to automation, scientific research, business software, and data engineering. Its broad ecosystem allows organisations to use the same programming language across different types of technical projects, depending on their specific requirements.
What Are the Pros and Cons of R?
R has several strengths that make it a popular choice for statistics, data analysis, research, and visualisation. At the same time, it has some limitations, especially when compared with Python for general-purpose programming and broader software development. Understanding these pros and cons can help you decide whether R fits your data science project.
Understanding these pros and cons can help you decide whether R is the right choice for your project, especially when your work involves statistical analysis, data visualisation, research, or working with large and complex datasets.
What are the Pros and Cons of Python ?
Python has several strengths that make it a popular choice for data science, machine learning, automation, and software development. At the same time, it has some limitations, especially when compared with R for specialised statistical analysis and research-focused work. Understanding these pros and cons can help you decide whether Python fits your data science project.
Understanding these pros and cons can help you decide whether Python is the right choice for your project, especially when you need a versatile language for data analysis, machine learning, automation, web development, or other technical tasks.
What Does the R Ecosystem Offer?
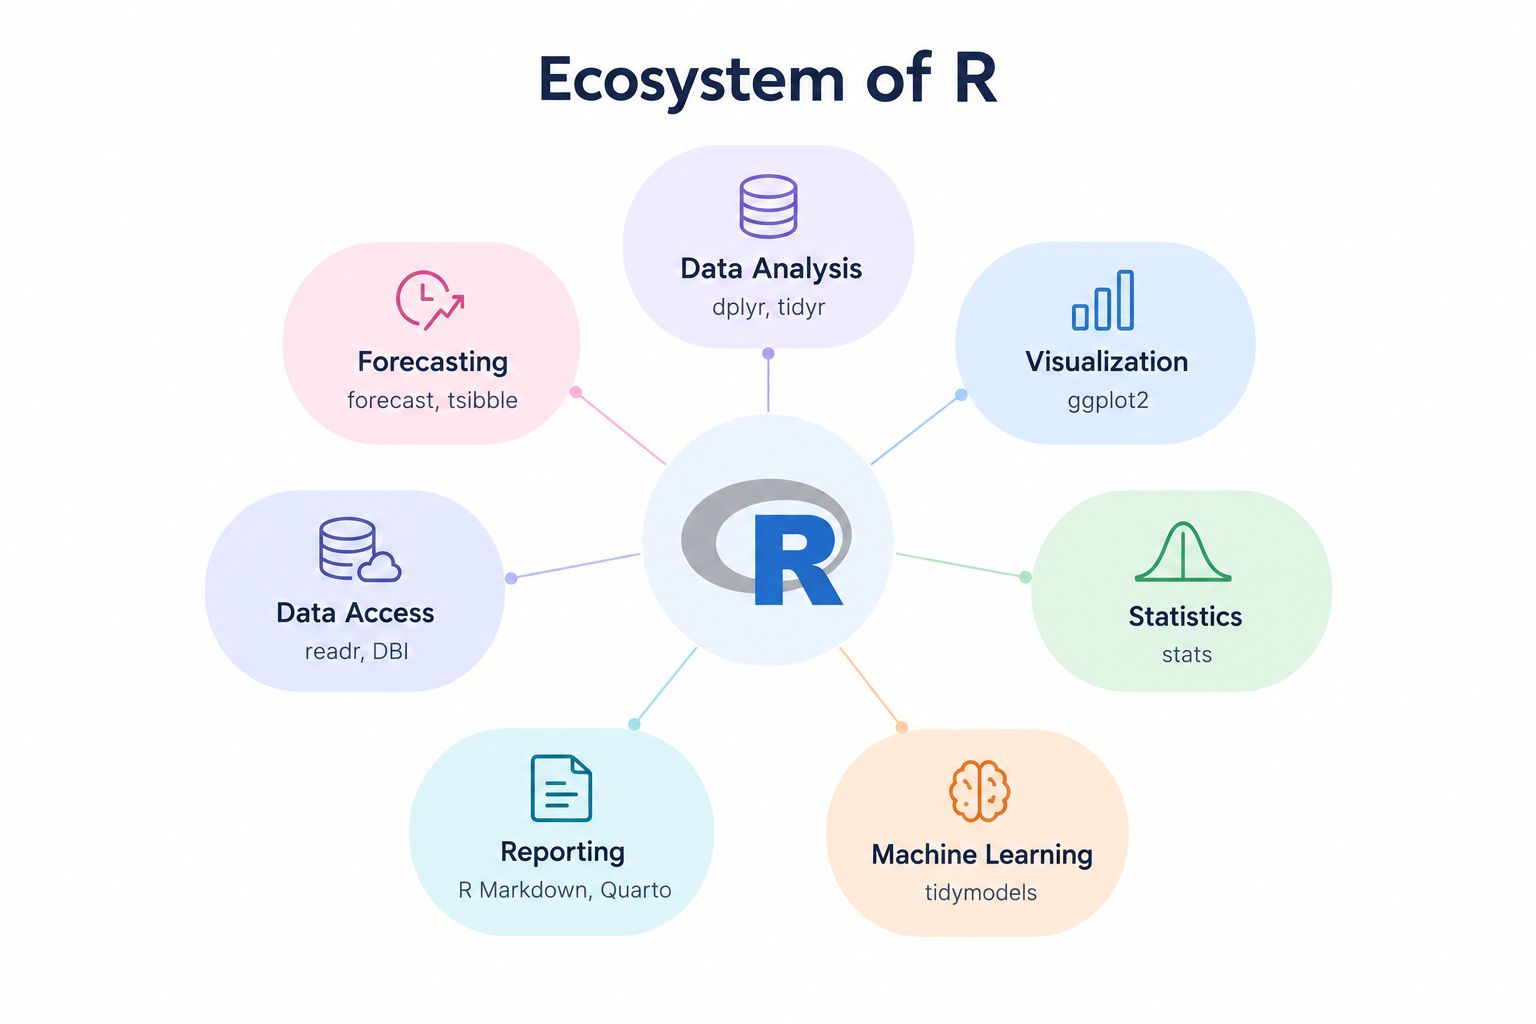
R has an ecosystem that includes packages, coding tools, visualisation libraries, reporting tools, and statistical frameworks. These resources make R useful for more than just programming commands. They support data analysis, statistical modelling, research, data visualisation, and machine learning.
The R ecosystem provides tools for stages of working with data. CRAN, which stands for Comprehensive R Archive Network, offers thousands of packages for tasks. Popular packages such as ggplot2 support data visualisation, while dplyr helps with data manipulation, and tidyr makes it easier to reshape datasets. Tidymodels gives tools for building and working with machine learning models.
R also includes tools that make data-focused work easier to organise. RStudio gives an environment for writing and running R code, managing projects and viewing results. R Markdown and Quarto let users combine code, explanations, charts and results into one report or document. Together these tools support the workflow from importing and preparing data to analysis, visualisation, modelling and reporting.
What Does the Python Ecosystem Offer?
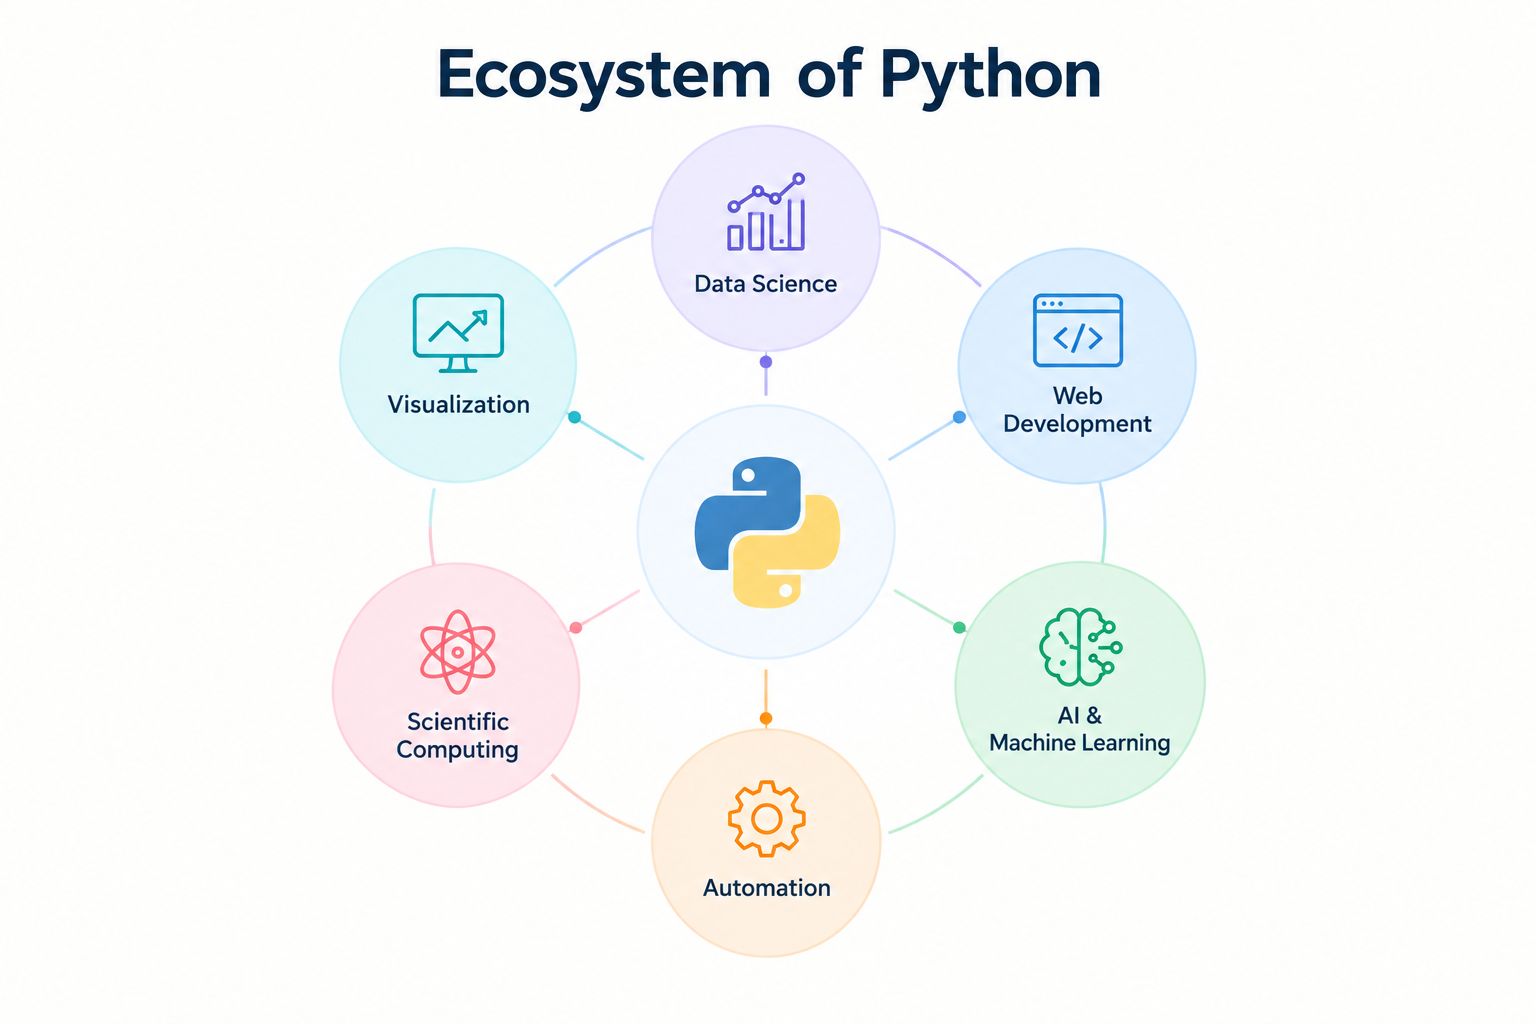
Python has an ecosystem made up of libraries, frameworks, development tools, and packages. This collection allows Python to handle a range of programming tasks. These resources make Python useful for data analysis, machine learning, artificial intelligence, web development, automation, scientific computing, and general software development.
Python also covers stages of the development process. NumPy is commonly used for computing, while Pandas supports data manipulation and analysis. Data visualisation tools such as Matplotlib and Seaborn help create charts. Explore datasets. For machine learning and artificial intelligence frameworks, such as Scikit-learn, TensorFlow and PyTorch provide tools for building and training models.
Python offers tools for building, testing and managing projects. PyPI (Python Package Index) hosts thousands of packages that developers can install to add functionality to their projects. Tools such as Jupyter Notebook, VS Code and PyCharm provide environments for writing, testing and organising Python code. Together, these components support stages of a workflow from writing and testing code to analysing data, building applications and deploying projects.
Conclusion
Python and R are both widely used programming languages, but they are suited to different types of work. Python supports a broad range of applications, including machine learning, artificial intelligence, automation, web development, scientific computing, and software development. R is more focused on statistical analysis, research, data visualisation, and working with complex datasets.
The choice between R and Python ultimately depends on the project requirements and the type of work involved. Python can be a practical choice for projects that require a versatile programming language across different applications, while R can be well suited to statistics-heavy analysis, research, and visualisation. Many professionals use both languages, choosing between them based on the tools, tasks, and requirements of each project.
Frequently asked questions

 WhatsApp
 Call Us
 Mail Us