


10 Cloud Monitoring Tools for Modern Cloud Operations


Introduction
Modern cloud environments rely on microservices, containers, and multiple providers. As systems spread across AWS, Azure, and GCP, teams lose clear visibility into application behavior and infrastructure health. Cloud monitoring tools help teams track performance, surface issues early, and maintain control across cloud-native workloads.
This growing need is reflected in recent market data. According to Fortune Business Insights, the global cloud monitoring market is valued at approximately $3.99 billion and is expected to grow steadily as organizations increase investment in cloud performance monitoring, observability tools, and usage analytics across hybrid and multi-cloud environments.
The sections below break down cloud monitoring tools in detail.
Cloud Monitoring Tools
Cloud monitoring tools sit at the center of how teams keep applications reliable once they’re running in the cloud. The right tool determines how quickly issues surface, how clearly systems can be understood, and how much effort it takes to maintain performance across changing workloads.
The tools below are among the most commonly evaluated cloud monitoring platforms across industries. Each one is reviewed individually, with a focus on what it monitors, where it fits best, and why teams choose it when comparing cloud monitoring solutions.
1. Datadog

Datadog is used by teams that need a unified view across cloud applications, infrastructure, and workloads, especially in distributed and cloud-native environments. It’s commonly evaluated when monitoring spans microservices, containers, and serverless components rather than a single layer
It is widely adopted by SaaS and digital product teams running workloads across AWS, Azure, and GCP, where fast correlation between application behavior and infrastructure signals is critical during incidents.
Datadog provides visibility across:
- Hosts, containers, Kubernetes, and serverless workloads
- Application performance monitoring for backend services and APIs
- Centralized logs, metrics, and traces correlated in one workflow
- Automated anomaly detection to surface unexpected performance issues
Pricing context:
Typically priced per infrastructure host, starting around $15 per host per month, with additional costs based on data volume and features enabled.
Trade-off to know:
As environments grow in size and complexity, monitoring costs need to be actively managed to avoid unexpected spend.
2. Dynatrace
Dynatrace is commonly evaluated in large, complex environments where manual monitoring and troubleshooting do not scale. It is designed for teams that need continuous visibility across applications, infrastructure, and services without configuring individual monitoring rules.
It is widely used in enterprise and regulated industries running multi-cloud, hybrid, and microservices-based architectures. Dynatrace relies on a single agent to automatically discover services, map dependencies, and build a live topology of the environment, which helps teams understand how changes impact applications at scale.
Dynatrace provides visibility across:
- End-to-end application transactions and service dependencies
- Infrastructure, containers, Kubernetes, and cloud platforms
- Logs, metrics, and traces are automatically correlated
- Automated anomaly detection to reduce manual root-cause analysis
Pricing context:
Dynatrace uses usage-based pricing, typically starting at around $0.04 per hour per host, with costs depending on the monitored components.
Trade-off to know:
The platform can be complex for smaller teams, and pricing models require careful evaluation in very large environments.
3. Amazon CloudWatch

Amazon CloudWatch is AWS’s native cloud monitoring service, designed to observe applications and infrastructure running inside the AWS ecosystem. It provides built-in visibility into AWS resources without relying on external monitoring platforms.
CloudWatch is commonly used by teams running workloads on EC2, RDS, Lambda, and S3 who want to monitor infrastructure metrics, application logs, and operational events directly within AWS.
Amazon CloudWatch provides visibility across:
- AWS infrastructure metrics and service health
- Application logs, events, and custom metrics
- Dashboards and alarms tied to AWS services
- Basic application and infrastructure performance signals
Pricing context:
Usage-based pricing, common costs start around $0.30 per custom metric per month and $0.50 per GB of log ingestion, with additional charges for dashboards, alarms, and retention.
Trade-off to know:
CloudWatch offers limited cross-service and cross-environment context. In complex systems, teams often need to manually correlate signals, and visibility outside AWS requires additional tools.
4. New Relic
New Relic is commonly evaluated by teams that want monitoring closely tied to application behavior and code-level performance. It is often chosen when developers need direct visibility into how deployments, code changes, and traffic patterns affect application performance.
It is widely adopted by SaaS and product-led teams building cloud-native applications across AWS, Azure, and GCP. New Relic brings metrics, logs, traces, and events together around application context, making it easier for developers to investigate issues without switching tools. The platform also supports AI-assisted analysis to help surface anomalies and patterns in telemetry data.
New Relic provides visibility across:
- Application performance for backend services, APIs, and databases
- Infrastructure and cloud resources supporting applications
- Logs, metrics, traces, and events correlated around application behavior
- Frontend and backend performance tied to user experience
Pricing context:
New Relic follows a usage-based pricing model, with paid plans typically starting around $0.30 per GB of data ingested, depending on features and data volume.
Trade-off to know:
Costs can rise as telemetry volume grows, and teams need to ensure that all required data sources are well-integrated to avoid blind spots.
5. Azure Monitor
Azure Monitor is Microsoft’s native monitoring service for workloads running on Azure, designed to help teams keep Azure-based applications stable and observable in production. It centralizes telemetry, allowing performance and operational issues to be tracked directly within the Azure ecosystem.
Azure Monitor collects data from applications, virtual machines, containers, databases, and network resources running on Azure. Using Application Insights and Log Analytics, it brings together metrics, logs, and distributed traces in a single platform.
Azure Monitor provides visibility across:
- Azure infrastructure metrics and resource performance
- Application and platform logs are collected centrally
- Distributed tracing and dependency data via Application Insights
- Dashboards, alerts, and queries using Azure-native tools
Pricing context:
Azure Monitor uses a usage-based pricing model. Log ingestion typically starts around $2.30 per GB, with additional costs for retention, alerts, and analytics features.
Trade-off to know:
Azure Monitor is strongest within Azure. Teams operating across multiple cloud providers often supplement it with third-party tools for broader correlation.
6. Google Cloud Operations Suite
Google Cloud Operations Suite is Google Cloud’s native observability platform for teams running production workloads on GCP. It’s designed around reliability-first operations, reflecting how Google runs large-scale systems.
The suite brings together monitoring, logging, tracing, and profiling, with deep integration into Google Kubernetes Engine (GKE) and managed services like Cloud Run, BigQuery, and Pub/Sub. It supports SRE practices by enabling teams to define and track SLIs and SLOs alongside application and infrastructure telemetry.
Google Cloud Operations Suite provides visibility across:
- GCP infrastructure metrics and service performance
- Kubernetes workloads and container-level signals in GKE
- Centralized logging for applications and managed services
- Distributed tracing and profiling for GCP-native workloads
Pricing context:
Log ingestion typically starts around $0.50 per GB, with additional costs based on retention.
Trade-off to know:
Best suited for GCP-first environments; broader multi-cloud visibility usually requires additional tools.
7. Grafana Cloud

Grafana Cloud is a fully managed observability platform that brings together metrics, logs, traces, dashboards, and alerting in one place. It’s designed for teams that want strong visibility without giving up control over how data is queried and visualized.
The platform is built on open-source components, including Grafana for dashboards, Prometheus or Mimir for metrics, Loki for logs, and Tempo for traces. This makes it a natural fit for teams already using open-source observability stacks and looking for a managed version rather than running everything themselves.
Grafana Cloud provides visibility across:
- Metrics from Prometheus-compatible sources
- Logs collected and queried through Loki
- Distributed traces via Tempo
- Highly customizable dashboards and alerts
Pricing context:
Usage-based pricing, with paid plans typically starting around $8–$10 per month, depending on data volume and selected components.
Trade-off to know:
Grafana Cloud favors flexibility over automation. Teams must configure data sources and correlations themselves, which can require more hands-on effort than fully opinionated observability platforms.
8. Prometheus

Prometheus is an open-source monitoring system built for cloud-native environments, especially Kubernetes. It’s widely adopted as the standard for collecting and querying time-series metrics in dynamic, containerized systems.
It focuses on scraping metrics from services and infrastructure, applying alerting rules, and integrating with service discovery. Prometheus pairs naturally with Grafana for visualization, which is why the two are commonly used together in cloud workloads.
Prometheus provides visibility across:
- Application and infrastructure metrics via exporters
Kubernetes clusters, nodes, pods, and services
- Custom metrics defined by engineering teams
- Rule-based alerting on time-series data
Pricing context:
Free and open source ($0). Operational costs depend on infrastructure and maintenance.
Trade-off to know:
Prometheus is metrics-focused. Logs, traces, long-term storage, and advanced analytics require additional tools and engineering effort.
9. Splunk Observability Cloud

Splunk Observability Cloud is built for organizations running large, distributed systems that generate high volumes of telemetry. It’s typically evaluated when teams need observability that can handle scale across infrastructure, applications, and services without breaking down under data load.
The platform extends Splunk’s long-standing strength in analytics into metrics, traces, and infrastructure monitoring. It’s well-suited for environments with many services and data sources, where teams need powerful search, dashboards, and analytics to understand system behavior across the estate.
Splunk Observability Cloud provides visibility across:
- Application performance and service dependencies
- Infrastructure and cloud resource behavior
- High-volume metrics, logs, and telemetry streams
- Dashboards and alerting are designed for large teams
Pricing context:
Plans typically start around $15 per host per month, depending on data volume and features.
Trade-off to know:
The platform’s depth and capacity come with higher cost and onboarding effort. Smaller teams or simpler setups may find it heavier than necessary.
10. AppDynamics

AppDynamics is an application performance monitoring platform used when application reliability is directly tied to business outcomes. It’s typically chosen in environments where performance issues affect revenue, customer experience, or SLA commitments.
The platform tracks business transactions end to end, using transaction snapshots and baselining to show how application behavior changes over time. By linking technical performance to user impact and business KPIs, AppDynamics helps teams prioritize issues based on business relevance rather than raw system signals.
AppDynamics provides visibility across:
- Business transactions and application request flows
- End-user experience and response-time behavior
- Code-level diagnostics and transaction snapshots
- Application health aligned with SLAs and business KPIs
Pricing context:
Typical pricing begins around $3000 per monitored application per year, varying by application size and modules selected.
Trade-off to know:
AppDynamics is application-first. Teams needing broad infrastructure or unified logs, metrics, and traces coverage may prefer a full-stack platform.
Monitoring Contexts: Teams, Architecture, Impact, and Scale
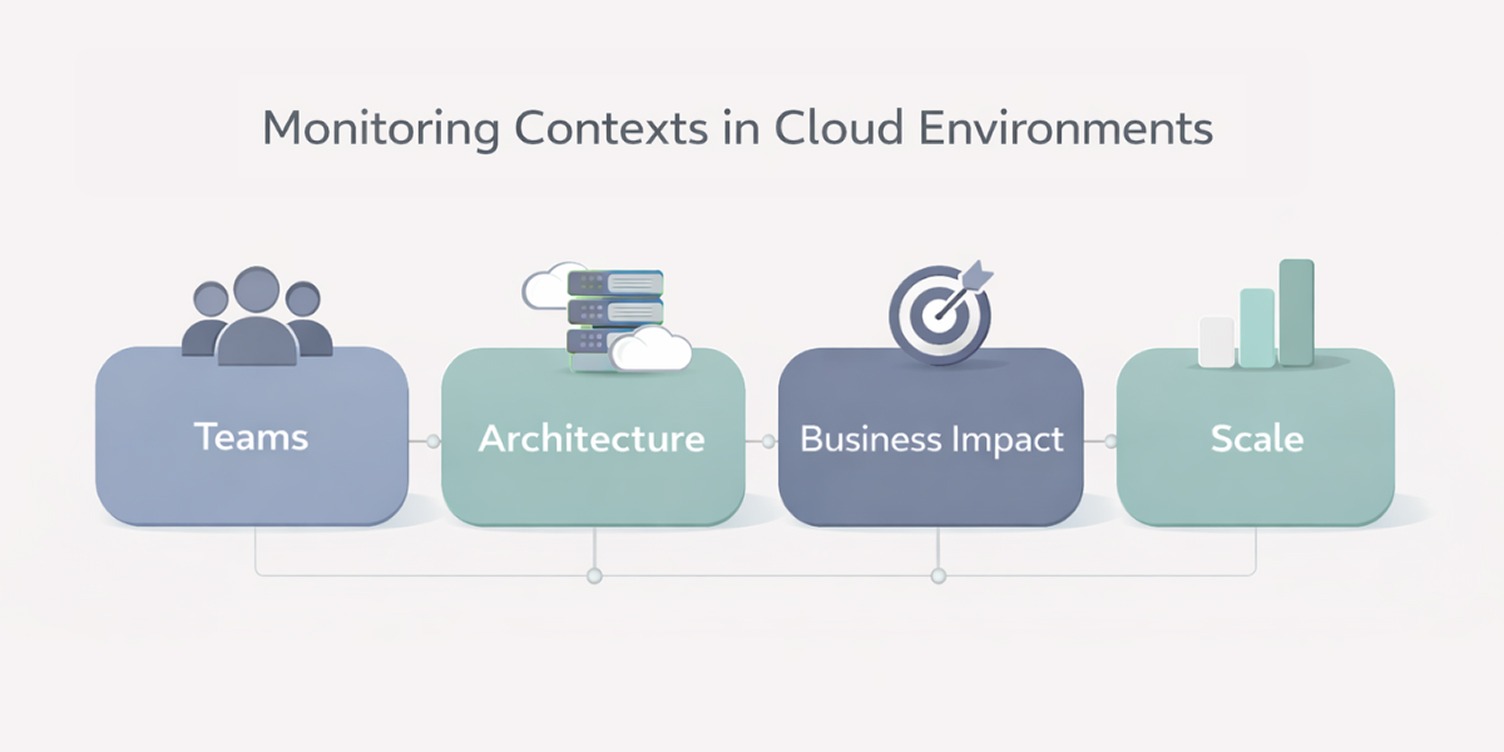
Cloud monitoring tools are applied differently across modern cloud environments. What works well in one setup can feel unnecessary or limiting in another. These differences usually come down to how teams operate, how systems are built, how critical workloads are, and how much scale and complexity are involved.
Who Owns Monitoring and Acts on Alerts
Engineering-led teams
Alerts are closely tied to application code and deployments. Engineers rely on monitoring to spot performance regressions, failed releases, and request-level issues, and they usually handle fixes themselves.
Platform or DevOps-led teams
The focus shifts toward overall system reliability and service health. These teams look at infrastructure behavior, service dependencies, and incident patterns across multiple applications and environments.
IT operations or centrally governed teams
Here, the emphasis is on stability, compliance, and oversight. Dashboards and alerts are used to track availability, operational trends, and adherence to internal or regulatory policies rather than day-to-day debugging.
How the System Is Architected
Beyond team structure and system design, monitoring priorities also change based on how critical a system is to day-to-day business operations.
Monitoring by Business Criticality
Internal systems
These typically prioritize cost control and baseline stability. Monitoring focuses on availability and resource usage rather than deep transaction-level insight.
Customer-facing systems
Here, uptime and responsiveness matter more. Latency and error rates directly affect user experience and require closer attention.
Revenue-impacting or SLA-bound systems
These systems need visibility into transactions, dependencies, and failure impact, since performance issues translate directly into business loss.
Monitoring by Scale and Complexity
Smaller environments
A limited number of services with predictable traffic can often rely on straightforward metrics and alerts.
Distributed systems
As services and ownership spread across teams, dependencies multiply, and issue isolation becomes harder without broader visibility.
High telemetry environments
Large volumes of signals require noise reduction, correlation, and prioritization to avoid alert fatigue and missed issues.
As scale and complexity increase, gaps in monitoring tend to surface faster, setting the stage for more advanced approaches.
Why Modern Cloud Systems Demand Advanced Monitoring Tools
Cloud-native systems outgrow basic monitoring quickly
Modern cloud applications are built on microservices, containers, managed services, and frequent deployments. Infrastructure is no longer static, and services don’t behave like long-running servers. In these environments, traditional host-level monitoring struggles to keep up.
Basic monitoring tools were designed for predictable workloads and stable infrastructure. Once teams adopt Kubernetes, serverless functions, or distributed APIs, gaps start to appear in visibility, dependency tracking, and performance analysis. This shift is why cloud-native monitoring tools have become a necessity rather than an upgrade.
Signal overload pushes teams toward AI-assisted monitoring
As systems grow, the volume of telemetry increases rapidly. Metrics, logs, and traces pile up across services, environments, and deployments. The challenge is no longer collecting data, it’s knowing which signals matter.
Modern cloud monitoring platforms increasingly rely on machine learning to:
- Identify unusual behavior without relying only on static thresholds.
- Reduce alert noise by prioritizing meaningful events.
- Surface patterns that would take teams hours to piece together manually.
This is where AI and ML add practical value: helping teams focus on real issues instead of drowning in data.
Monitoring evolves from visibility to operational decision support
Today’s monitoring tools are expected to do more than display dashboards. Teams rely on them to understand impact, trace issues across services, and decide what needs attention first.
Advanced tools emphasize correlating logs, metrics, and traces, tying performance data to workloads and services rather than isolated resources. This shift supports faster diagnosis and more informed decisions in complex cloud environments, especially when systems span multiple teams and platforms.
This evolution sets the foundation for understanding how monitoring differs from observability, which focuses on explaining why systems behave the way they do.
Cloud Monitoring Tools for Public, Hybrid, and Multi-Cloud
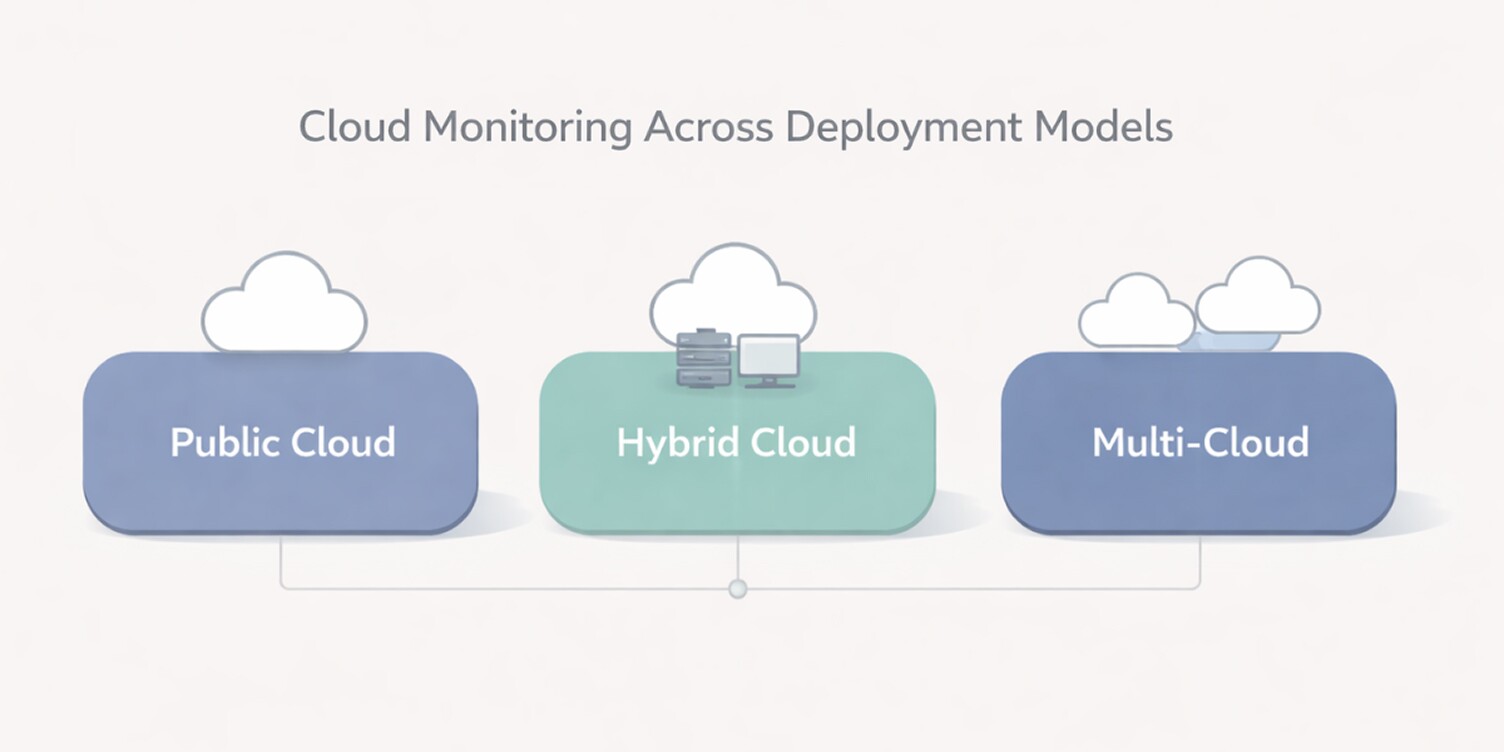
Cloud monitoring tools behave very differently depending on where workloads run. The same tool that feels sufficient in a single-cloud setup can become limiting once teams introduce on-prem systems or a second cloud provider. Understanding these environments helps narrow down which monitoring tools will actually hold up in production.
Public, hybrid, and multi-cloud environments place very different demands on monitoring tools. A tool that works well in a single-cloud setup may struggle with visibility, consistency, or operational overhead as environments become more complex.
This is why evaluating cloud monitoring tools without considering deployment context often leads to poor long-term fit.
Public Cloud Environments
In single-cloud environments, monitoring is often tightly integrated with the cloud provider’s services. Native tools make it easy to collect metrics, logs, and basic application signals with minimal setup.
For teams operating fully within one cloud, this approach works well early on. Limitations usually surface when applications grow more distributed or when teams need consistent visibility across multiple services rather than isolated resource views.
Hybrid Cloud Environments
Hybrid environments combine cloud workloads with on-prem systems, legacy infrastructure, or private data centers. Monitoring becomes more complex because telemetry is spread across different platforms with different data formats and access patterns.
In these setups, teams often look for monitoring tools that can:
- Collect data consistently across cloud and on-prem systems.
- Present a unified view of application and infrastructure health.
- Handle network boundaries and integration gaps cleanly.
Hybrid cloud platforms tend to surface visibility gaps when monitoring tools aren’t designed to span on-prem and cloud systems.
Multi-Cloud Environments
Multi-cloud setups introduce another layer of complexity. Each cloud provider exposes metrics and logs differently, and relying on separate native tools makes cross-environment troubleshooting harder.
Teams operating across multiple clouds typically prioritize monitoring tools that:
- Normalize data from different providers.
- Offer consistent dashboards and alerting.
- Reduce the need to switch between multiple consoles.
In these environments, the value of centralized cloud monitoring platforms becomes more apparent, especially as applications and teams scale.
How to Compare and Choose the Right Cloud Monitoring Tool
Choosing a cloud monitoring tool is less about finding the most feature-rich option and more about finding the right fit for how your systems and teams operate. Tools that perform well in one environment can fall short in another, especially as cloud architectures and workloads evolve.
This section breaks down a practical way to evaluate cloud monitoring tools so the decision holds up beyond initial deployment.
Define the operating context before comparing tools
Before looking at features, define the context in which the tool must operate. Most monitoring failures happen when tools are evaluated in isolation from how systems and teams actually work.
At a minimum, be clear on:
- where workloads run (single cloud, hybrid, or multi-cloud).
- how applications are deployed (VMs, containers, serverless).
- who owns monitoring and responds to incidents.
This context immediately narrows the field and prevents shortlisting tools that won’t scale with your environment or workflows.
Compare tools across decision-critical dimensions
Rather than comparing long feature lists, it’s more effective to evaluate tools across a small set of decision-critical dimensions. These factors tend to determine long-term fit far more than individual capabilities.
This comparison helps surface practical tradeoffs early, before time is spent on detailed evaluations.
How to Use These Criteria to Make a Practical Decision
Use the table above to narrow options, not to score tools equally across every dimension. Start by identifying the two or three factors that matter most for your environment today.
- If you operate across hybrid or multi-cloud environments, eliminate tools that don’t provide consistent visibility outside a single provider.
- If multiple teams rely on the same platform, prioritize signal correlation and operational effort over raw feature count.
- If telemetry volume is already high or growing, evaluate cost behavior early rather than treating pricing as a later concern.
This approach turns the comparison into a filter. Instead of asking which tool does everything, the focus shifts to which tool fits your operating reality with the fewest compromises.
Closing Thoughts
Cloud monitoring tools play a critical role once systems move beyond simple, predictable setups. As applications grow more distributed and teams rely on shared platforms, the difference between basic visibility and actionable insight becomes clear.
The right tool choice depends less on feature lists and more on how well a platform fits your environment, workflows, and scale. Taking time to understand these factors upfront helps avoid blind spots, operational friction, and costly changes later.
With that context in place, the following questions address some of the most common concerns teams have when evaluating cloud monitoring tools.
 WhatsApp
 Call Us
 Mail Us