


Tools and Techniques you should use for Azure FinOps


Azure FinOps practices help organizations track, allocate, and optimize cloud spending while keeping costs aligned with business outcomes.
If rising bills from idle virtual machines or unexpected storage charges sound familiar, these methods directly address those challenges.
This blog emphasizes essential tools and techniques built for Azure environments, drawing on Microsoft documentation and proven industry practices.
Understanding Azure FinOps basics
FinOps combines financial accountability with cloud operations to foster collaboration across teams.
In Azure, it starts with visibility into usage data, moves to allocation by department or project, and ends with ongoing adjustments to match actual needs.
Teams often struggle with fragmented cost views; engineers provision resources without cost context or tools to manage resources across Azure workloads, while finance waits for monthly reports.
Azure FinOps resolves this by integrating cost signals into daily workflows. For instance, a development team might overspend on underused databases; techniques here show how to spot and fix that.
Key phases include:
Inform: Gather data on consumption and expenses.
Optimize: Apply rules and recommendations to trim waste.
Operate: Review results and refine processes monthly.
Begin with the basics:
- Export your first Azure cost report today to baseline your current spend.
- This reveals patterns, like peak-hour compute usage across IoT and other high-usage workloads, that inform later decisions.

Essential native tools for Azure FinOps
Microsoft provides built-in tools that handle core FinOps tasks without extra costs. These integrate directly with the Azure portal, making them accessible for teams new to cost management.
Azure cost management and billing
This tool breaks down bills by service, subscription, and resource group.
It supports forecasts based on historical data, helping predict quarterly expenses.
Here's how to use it:
Navigate to the Azure portal and select Cost Management + Billing.
Create budgets with thresholds Set alerts for 80% of your limit to catch overruns early.
Analyze trends: Filter by API management or storage to identify spikes.
Azure Advisor
Advisor scans your environment for optimization opportunities, prioritizing high-impact changes.
It focuses on cost, security, and reliability.
Key features:
Recommendations for rightsizing VMs reduce instance size if CPU utilization stays below 30%.
Suggestions for reservations: Commit to one-year terms for steady workloads to save up to 72%.
Azure Monitor and Resource Graph
Azure Monitor tracks performance metrics tied to costs, while Resource Graph queries resources across subscriptions for broad visibility.
You can also combine them:
Query idle resources with KQL (Kusto Query Language) like Resources | where type == 'microsoft.compute/virtualmachines' | where properties.storage Profile.osDisk.managedDisk == true | summarize count() by resourceGroup.
This lists unused VMs for shutdown.
In practice, a media company used Resource Graph to find 15% orphaned disks, reclaiming $1,500 yearly.
Advanced techniques for cost optimization in Azure
Techniques build on tools to drive actions. Focus on tagging, rightsizing, and commitments to address common pain points like unallocated costs or overprovisioned services.
Implement cost allocation with tagging.
Tags assign metadata to resources, enabling breakdowns by team, environment, or application.
Without tags, 30% of costs often go unassigned, per industry reports.
Steps to tag effectively:
Define a policy: Use Azure Policy to enforce tags like "Department:Engineering" or "Project:AppV1."
Apply retroactively: Script tags via Azure CLI: az resource tag --ids /subscriptions/{sub-id}/resourceGroups/{rg} --tags Owner=dev-team.
Allocate in Cost Management: Group by tag to chargeback accurately.

Leverage reservations and savings plans.
Commit to usage for discounts: Reservations for specific instances save 72% on one-year terms; savings plans offer flexibility across VM families.
How to apply:
Analyze usage in Cost Management for steady workloads like databases.
Purchase via portal: Select RI marketplace for SQL or compute.
Monitor coverage: Aim for 70% to maximize returns.
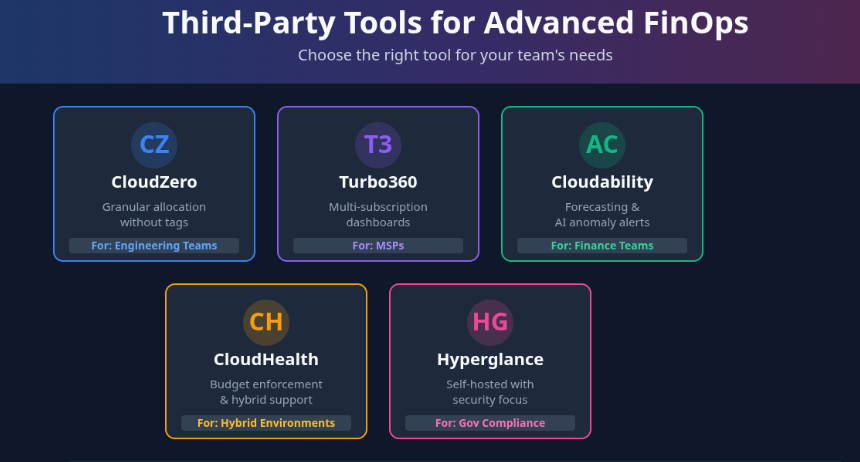
Third-Party tools to enhance Azure FinOps
Native options work for basics, but third-party tools add depth for multi-tenant or complex setups.
They often include anomaly detection and cross-cloud views.
The Azure FinOps toolkit
Microsoft's FinOps Toolkit extends capabilities with scripts and templates.
It's free, GitHub-hosted, and updates monthly.
Core components:
FinOps hubs: Ingests data into Azure Data Explorer or Fabric for queries. Deploy via Bicep: Costs ~$120/month base + $10 per $1M monitored.
Power BI reports: Pre-built dashboards for trends; customize with FOCUS spec for standardized data.
Workbooks: Interactive views in Azure Monitor for optimization—e.g., idle resource scans.
Azure optimization engine: Custom recommendations via PowerShell.
Setup:
Clone repo: git clone https://github.com/microsoft/finops-toolkit.
Deploy the hub template in the portal.
Query example: In Data Explorer, Costs | summarize sum(Cost) by ServiceName | where Cost > 1000 for top spenders.
How can you build a FinOps Culture in Your Azure Team
Tools alone don't suffice; culture drives adoption. Address pain points like siloed data by involving stakeholders early.
Practices:
Monthly reviews: Share dashboards in cross-team meetings.
Training: Use Microsoft Learn paths on FinOps.
Incentives: Tie bonuses to cost targets.
For MSPs, extend to clients via delegated access. Track maturity with assessments from the Azure FinOps Guide.
 WhatsApp
 Call Us
 Mail Us