


Mobile App Development Statistics: Market Data, Usage, and Insights
-1.jpg&w=3840&q=75)


App revenue has crossed USD 167 billion, and mobile now accounts for more than 90% of global internet time not through browsers, but through apps that users open an average of ten times a day.
What has changed over the past few years is not just how many people use apps, but how deeply embedded mobile is in purchasing decisions, financial behavior, content consumption, and brand interaction. The industry is no longer measuring success in download volume. Monetization depth, retention performance, and engagement architecture are the metrics that determine which products scale and which plateau.
That shift has also raised the stakes for everyone building in this space. User tolerance for poor performance is lower, the cost of acquiring and losing a user is higher, and the window to demonstrate value after an install is shorter than it has ever been. Getting someone to download an app has become the easier half of the problem.
Most teams underestimate this. Engineering and product investment get concentrated at launch while retention architecture, stability engineering, and monetization design are treated as second-phase concerns, by which point the data has already made the verdict.
Looking at the numbers changes the framing. This page brings together 60+ mobile app development statistics for 2026 across market size, platform dynamics, monetization models, retention benchmarks, regional performance, and development costs to give founders, CTOs, and product teams a factual baseline for the decisions they are making right now.
Key Mobile App Development Statistics at a Glance
Mobile App Market Size, Growth, and Forecast
Mobile app growth is no longer driven purely by new users. The market is expanding through deeper monetization, higher engagement per user, and stronger revenue extraction from existing audiences. The data below breaks down how this shift is shaping overall market trajectory and regional dynamics.
Market Size and Trajectory
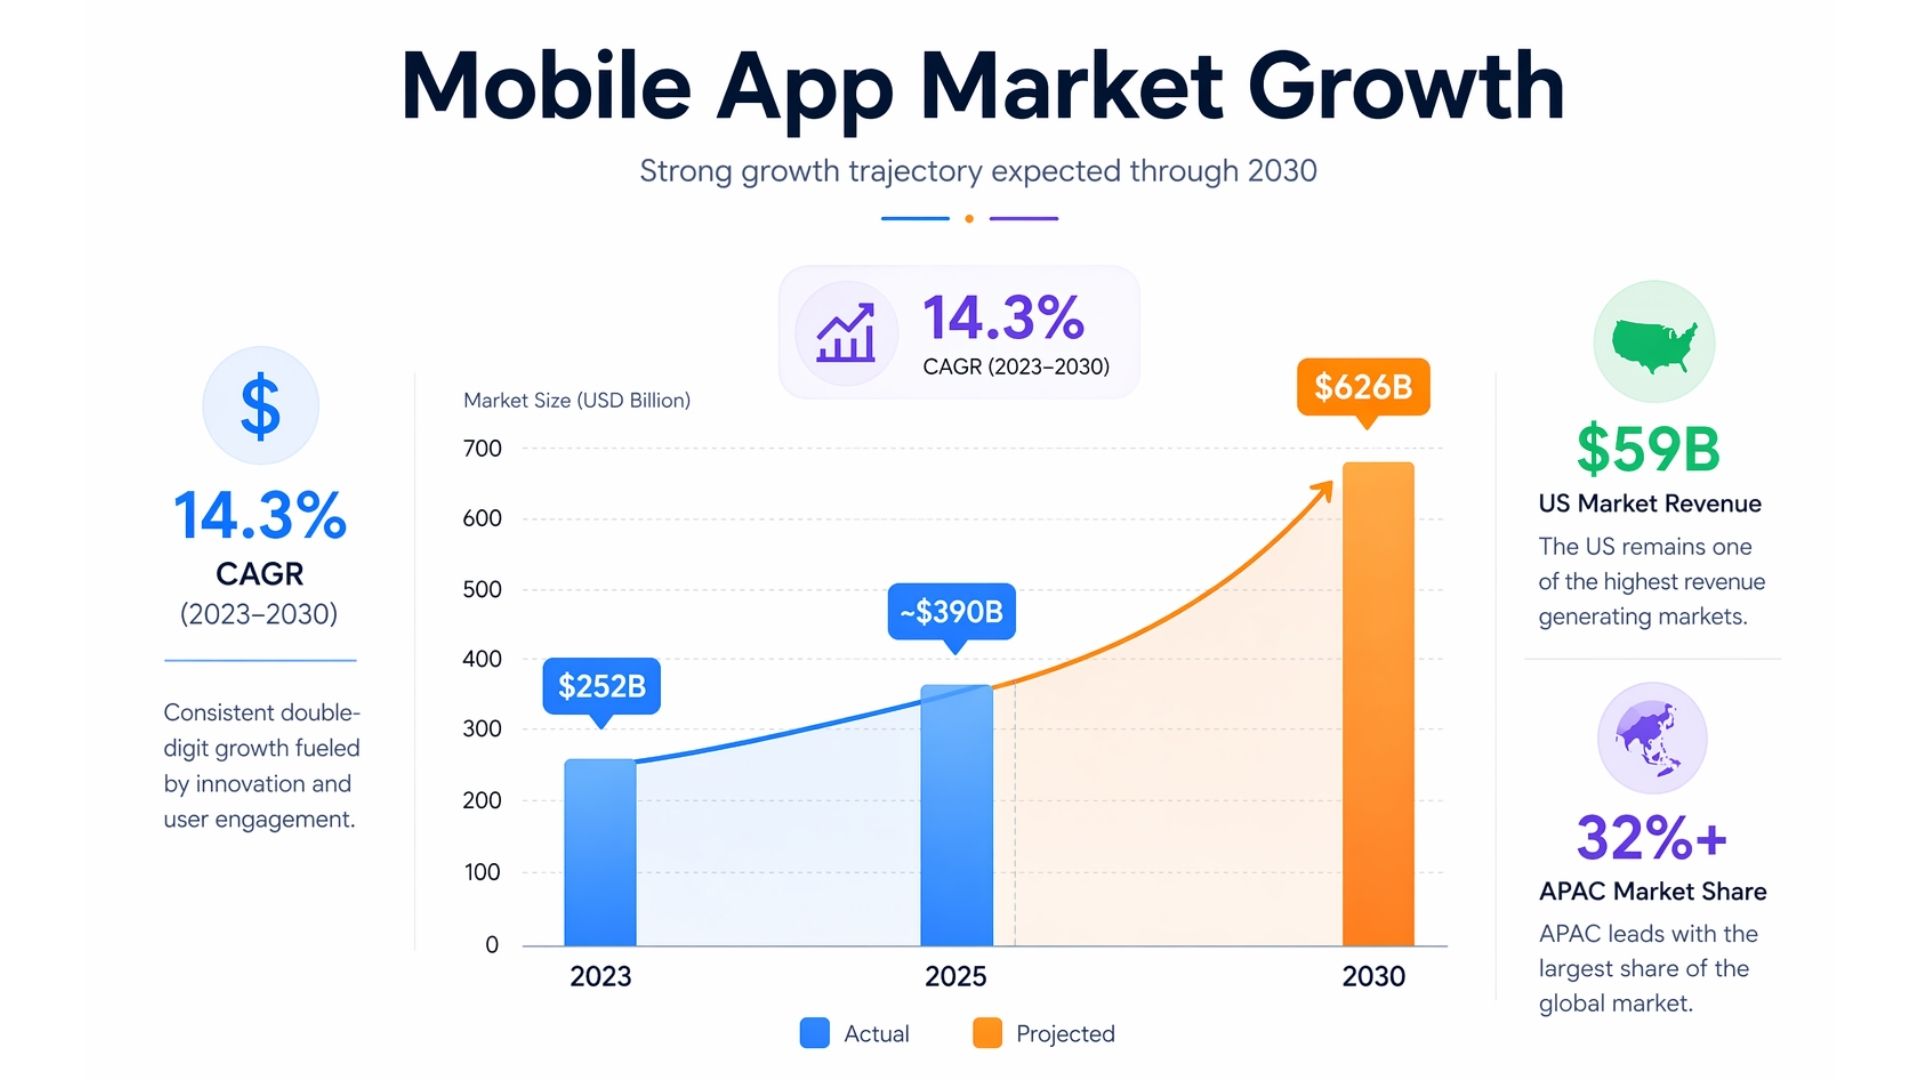
The global mobile application market was valued at USD 252.89 billion in 2023 and is projected to reach USD 626.39 billion by 2030, growing at a CAGR of 14.3% from 2024 to 2030,.
Downloads grew just 0.8% year-over-year in 2025, while IAP revenue surged 10.6%, confirming a structural shift in how the market creates value. Growth is now driven by monetization depth from existing users, not by new-user acquisition volume, which has plateaued in mature markets.
A parallel forecast from Mordor Intelligence estimates the mobile application market will grow from USD 333.93 billion in 2025 to USD 391.3 billion in 2026, with a longer-term trajectory toward USD 864.5 billion by 2031 at a 17.18% CAGR. The US mobile application market alone is projected to grow at a CAGR of 14.1% through 2030, driven by subscription depth and premium IAP spending.
Three Drivers Fueling the Surge
Smartphone adoption is expanding the addressable base. 7.4 billion smartphones are now in use globally, approximately 87% of all mobile handsets, with app-first users in emerging markets representing the next major growth wave, per DataReportal Digital 2026.
Generative AI is compressing development cycles and expanding revenue simultaneously. Time spent in generative AI apps reached 48 billion hours in 2025, roughly 3.6x the 2024 total, with session volume exceeding 1 trillion, signaling that engagement depth is accelerating faster than user acquisition.
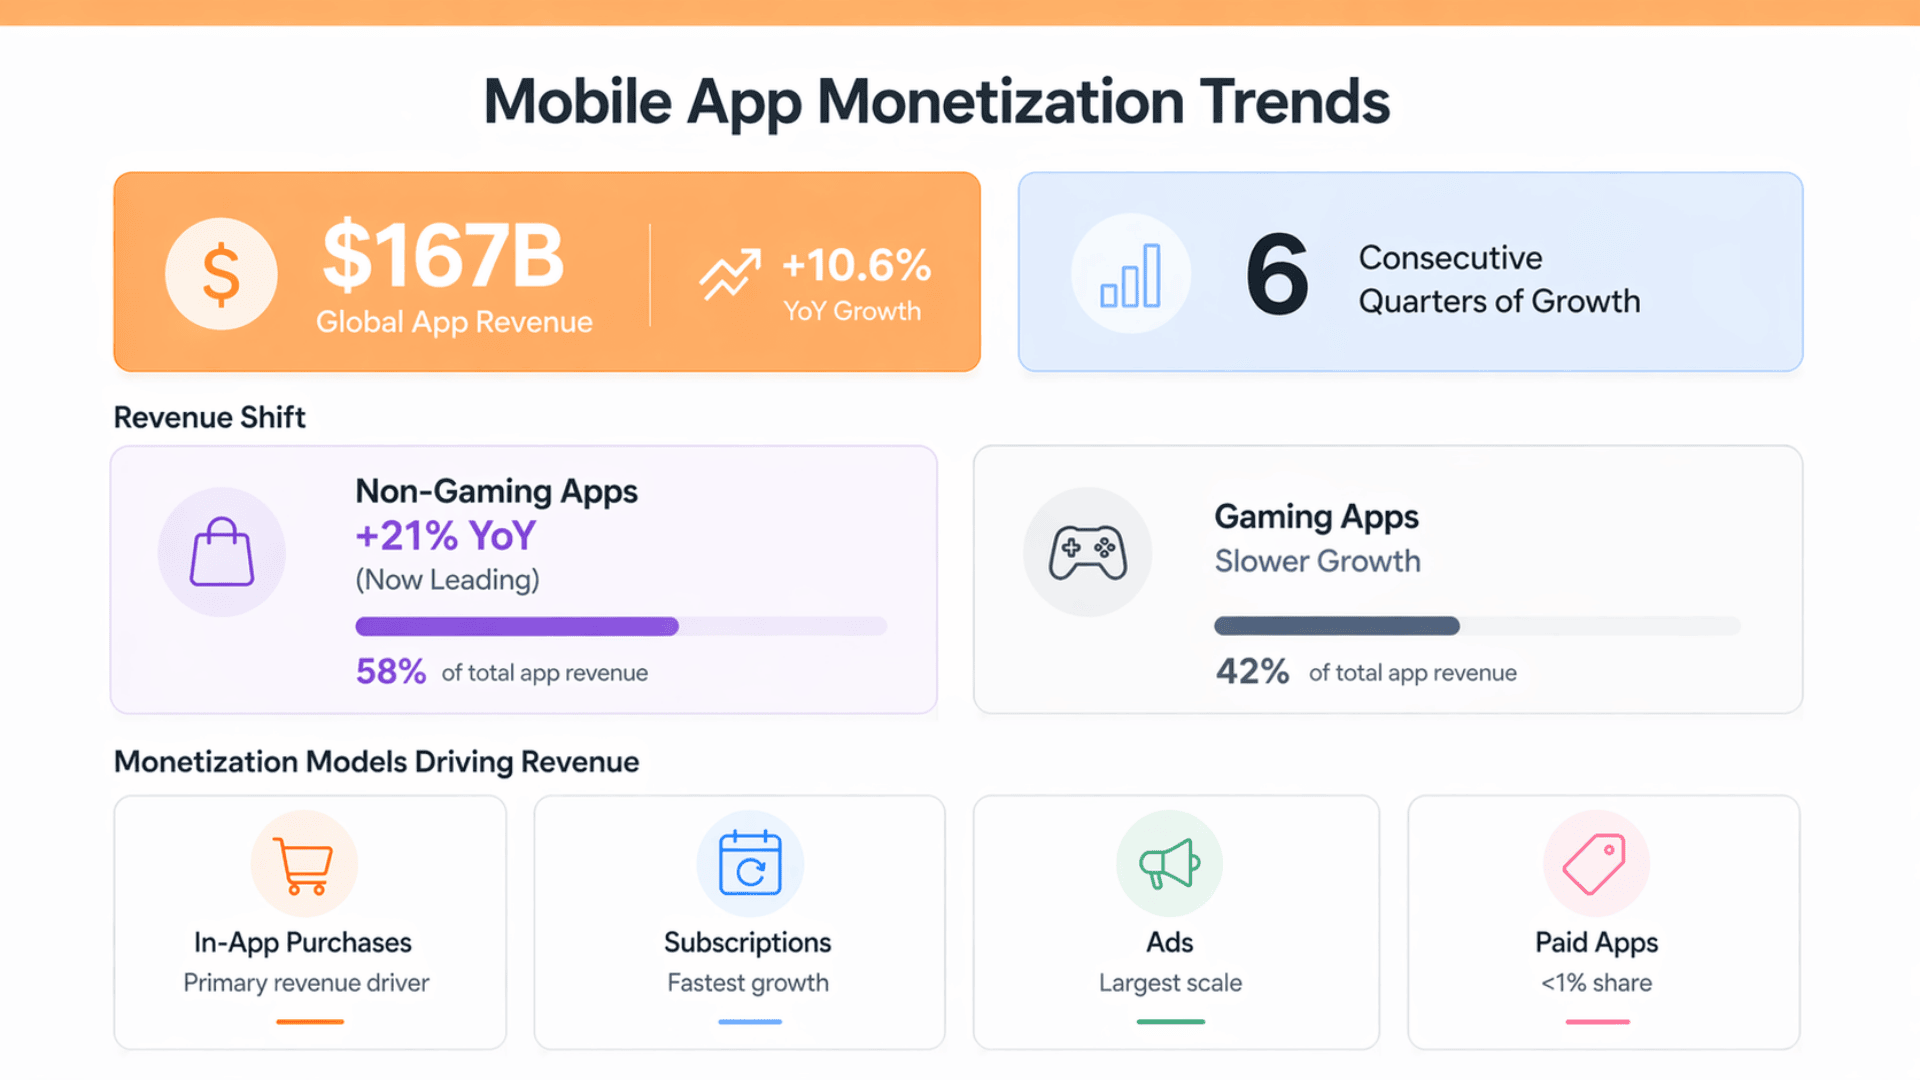
Non-gaming IAP revenue surpassed gaming for the first time in 2025. Android and iOS app consumer spending increased to USD 166.8 billion in 2025, with apps overtaking games in mobile consumer spending, growing 21% year-over-year.
Regional Growth Projections
Asia Pacific dominated the global mobile app market with more than 32% revenue share in 2023, China's market is projected to grow at a CAGR of 15.8%, outpacing the global average driven by short-form video ecosystems and super-app platforms that consolidate multiple use cases under a single interface.
Europe outpaced even the US in 2024, with IAP revenue climbing 24% year-over-year, making it the fastest-growing region by revenue despite lower total volume than North America or APAC. South America is the fastest-growing region at 12.07% CAGR between 2026 and 2031, per Mordor Intelligence, driven by digital financial inclusion and growing smartphone penetration.
According to research centers, 98% of Americans now own a cellphone and 91% own a smartphone, reflecting the near-total saturation of mobile in developed markets and the reason that revenue depth, not new-user volume, is the primary growth lever in those economies.
Revenue growth has structurally decoupled from download growth. Businesses planning mobile investment cannot rely on organic discovery volume alone. Retention depth, monetization architecture, and engagement mechanics must be defined at product inception not retrofitted post-launch.
AI in Mobile Apps Statistics and Growth Trends
-2.jpg)
AI has moved from being a feature layer to becoming core product infrastructure in mobile applications. The following data highlights how AI-driven apps are scaling faster in both engagement and monetization compared to traditional app categories.
AI's Impact on the Mobile App Ecosystem
AI is no longer a premium feature, and it is the foundational architecture of the most successful apps in 2026.
Generative AI apps recorded 254% year-over-year IAP revenue growth in 2025, led by ChatGPT at USD 3.4 billion in annual IAP revenue, per Business of Apps. Revenue growth at this rate significantly outpaced even the explosive download numbers, proving that monetization conversion, not acquisition volume, is the defining metric for AI apps.
In 2025, three apps, ChatGPT, CapCut, and WeTV, each surpassed USD 1 billion in IAP revenue for the first time, and none of them were games. This marks a definitive shift in where the highest-value mobile revenue is being generated away from traditional gaming and toward AI-powered utility and media products.
AI app downloads grew 148% year-over-year to reach 3.8 billion in 2025, while session volume in generative AI apps exceeded 1 trillion, growing faster than downloads. This confirms that existing users are deepening engagement faster than apps are acquiring new ones, which is the pattern that precedes sustained monetization compounding.
According to Statista, ChatGPT recorded nearly 7.4 million downloads in its first 10 days of release, the fastest-growing generative AI app launch on record, illustrating the scale of demand when a product genuinely solves a new class of user problem.
Paid installs in generative AI grew 200% year-over-year in 2024, and non-gaming app installs in generative AI categories outpaced all other segments, per AppsFlyer's Top 5 Data Trends Report, confirming AI's structural lead as a growth driver across mobile marketing as well as product revenue.
Product roadmaps for 2026-2028 require an explicit AI architecture decision. Building production-grade AI infrastructure into the app layer, including on-device inference, real-time personalization, and privacy-preserving model deployment, is a core engineering planning input, not a future-phase consideration.
Mobile App Downloads, Users, and Platform Statistics
Mobile has become the default interface for the internet, with billions of users interacting through apps daily. This section looks at how downloads, user distribution, and platform dynamics define the current mobile ecosystem.
App Store Downloads and User Base
142.2 billion apps and games were downloaded in 2025, a 3.1% increase on the previous year, with Google Play responsible for 104.6 billion downloads, 73.5% of the total, and iOS accounting for 36.6 billion.
5.78 billion unique mobile users existed worldwide as of October 2025, representing 70.1% of the global population, as per the industry report. 96% of all internet users access the internet via mobile at least some of the time, making mobile the primary interface layer for the global internet, not a secondary channel.
India led all countries in download volume at 25.5 billion installs in 2025. The US app market generated USD 52.3 billion in 2024, a 16.4% increase on 2023 values, with US consumers spending USD 184 on average per year on apps. This divergence between the volume leader and the revenue leader illustrates the structural difference between growth-market and monetization-market strategies.
The global mobile app market had 3.3 to 3.5 million active apps on Google Play and 2.3 million on the Apple App Store in 2024. 80% of app downloads and spending occur outside the country where the app was developed, making localization a revenue-critical launch decision, not a growth-phase consideration.
According to ITU's Facts and Figures 2025, 5G now reaches more than half of the global population and accounts for more than one-third of all mobile broadband subscriptions, a connectivity shift that is enabling the next generation of real-time, AI-powered app experiences to become viable at scale.
Platform Comparison: iOS vs Android
Android holds approximately 70% of global mobile OS market share by device count versus iOS's approximately 27%, per StatCounter. iOS was responsible for 70% of app consumer spending in 2025, despite its smaller device share, per Business of Apps, consistently generating significantly higher revenue per user across subscription, IAP, and paid categories.
Subscription revenues increased to USD 79.5 billion in 2025, with iOS responsible for 73% of that revenue, reinforcing why subscription products targeting Western markets should prioritize iOS engineering depth.
Mobile App Usage Statistics and User Behavior
User behavior in mobile apps is now defined by depth, frequency, and habit formation rather than simple usage metrics. The statistics below explain how time spent, engagement patterns, and attention concentration shape product success.
Time Spent and Usage Behavior
Users spent 5.3 trillion hours in apps globally in 2025, averaging 3.6 hours per user per day, with approximately 10 apps opened daily, according to the US Time Spent with Media 2025 report.
90% of mobile time is spent inside apps, not mobile browsers. Social apps alone accounted for more than 2.5 trillion hours in 2025, over 90 minutes per user per day, establishing social as the dominant category for total time captured on mobile platforms.
The average user engages with 34 apps per month (+5.4% YoY), per Business of Apps, but 49% of apps are uninstalled within 30 days, as per mobile marketing research. This gap between breadth and depth confirms that time-to-value during onboarding is the single most critical retention lever available to any mobile product team.
77% of app time is typically concentrated on a user's top 3 apps, creating a structurally fixed daily attention ceiling that new entrants must breach deliberately through habit-loop design, not simply through acquisition spend.
According to industry statistics, nine in ten US adults now go online every day, including 41% who report being online almost constantly, a behavioral baseline that frames the competitive intensity for attention inside apps.
Push Notifications and Re-Engagement
In-app messages are proven to boost retention by up to 30% when properly implemented, as per user retention guide. For non-social apps competing against high-time-capture categories, notification architecture and re-engagement mechanics are not optional UX features, they are direct contributors to Day 7 and Day 30 retention outcomes.
For non-social, non-AI apps, the challenge is building sufficient daily habit loops to compete against entrenched attention concentration. Widget integrations, lock-screen access, and notification architecture are engineering priorities, not post-launch enhancements.
App Monetization Trends, Revenue, and Spending Data
Revenue in mobile apps is no longer tied directly to download volume. Monetization strategies, pricing models, and user spending behavior now determine which apps scale sustainably and which plateau.
Revenue Streams and Consumer Spending
Revenue from in-app purchases and paid apps reached USD 167 billion in 2025 across iOS and Google Play, a 10.6% year-over-year increase, per Business of Apps App Revenue Data. Global IAP revenue climbed to a record high of nearly USD 41 billion in Q2 2025 alone, marking six consecutive quarters of at least 10% year-over-year IAP growth.
Non-gaming IAP revenue surpassed games for the first time in 2025, growing 21% year-over-year, per Business of Apps. This structural shift reflects the maturation of subscription-based productivity, AI, and lifestyle app categories, which now compete directly with gaming for both revenue share and user time.
Mobile ad spend in 2025 reached USD 419 billion, a 7.4% increase on the previous year, per Business of Apps. The Apple App Store is projected to hold a 53.2% share of mobile application market revenue in 2026, maintaining its revenue leadership despite Android's dominant device share.
User acquisition ad spend reached approximately USD 65 billion globally in 2024, a 5% rebound after a prior-year decline, with non-gaming app categories accounting for an increasing share, per AppsFlyer's Top 5 Data Trends Report. Hybrid monetization models combining IAP and in-app advertising delivered 146% ROAS by Day 90 for Android mid-core games, versus 93% for IAP-only approaches.
Subscriptions are growing fastest; in-app purchases dominate volume; paid downloads are functionally irrelevant at scale. Monetization architecture must be defined before product engineering begins not retrofitted after launch.
Mobile App Performance Metrics and Stability Benchmarks
Performance is no longer just a technical metric it directly impacts user retention, ratings, and app store visibility. The following benchmarks outline the stability and performance standards required for competitive mobile apps.
Crash-Free Session Rate Standards
The industry median crash-free session rate sits at 99.95%. Top-performing apps at the 75th percentile maintain 99.99%, the five-nines standard. Apps at the 25th percentile score 99.77% below the threshold that correlates with algorithmic ranking suppression in both major app stores.
The iOS median crash-free session rate is 99.91%, while Android sits at 99.80%, reflecting the higher device fragmentation across the Android ecosystem and the additional engineering overhead required to achieve equivalent stability across manufacturer variations and OS versions.
82% of users say stability is an extremely important factor when choosing an app, as oer Mobile User Expectations report. 63% of users will uninstall an app after three crashes or fewer, making a crash-free rate a direct contributor to organic retention, not just a QA milestone.
Stability is not a QA milestone it is an organic acquisition variable. Poor crash rates suppress app store ranking through algorithmic penalties, directly increasing paid acquisition dependency and compounding CAC over time.
Mobile App Retention Rates and Churn Statistics
Retention is the clearest indicator of product-market fit in mobile applications. These statistics show how quickly users drop off and what separates high-performing apps from the majority that fail to retain users.
Global App Retention Benchmarks
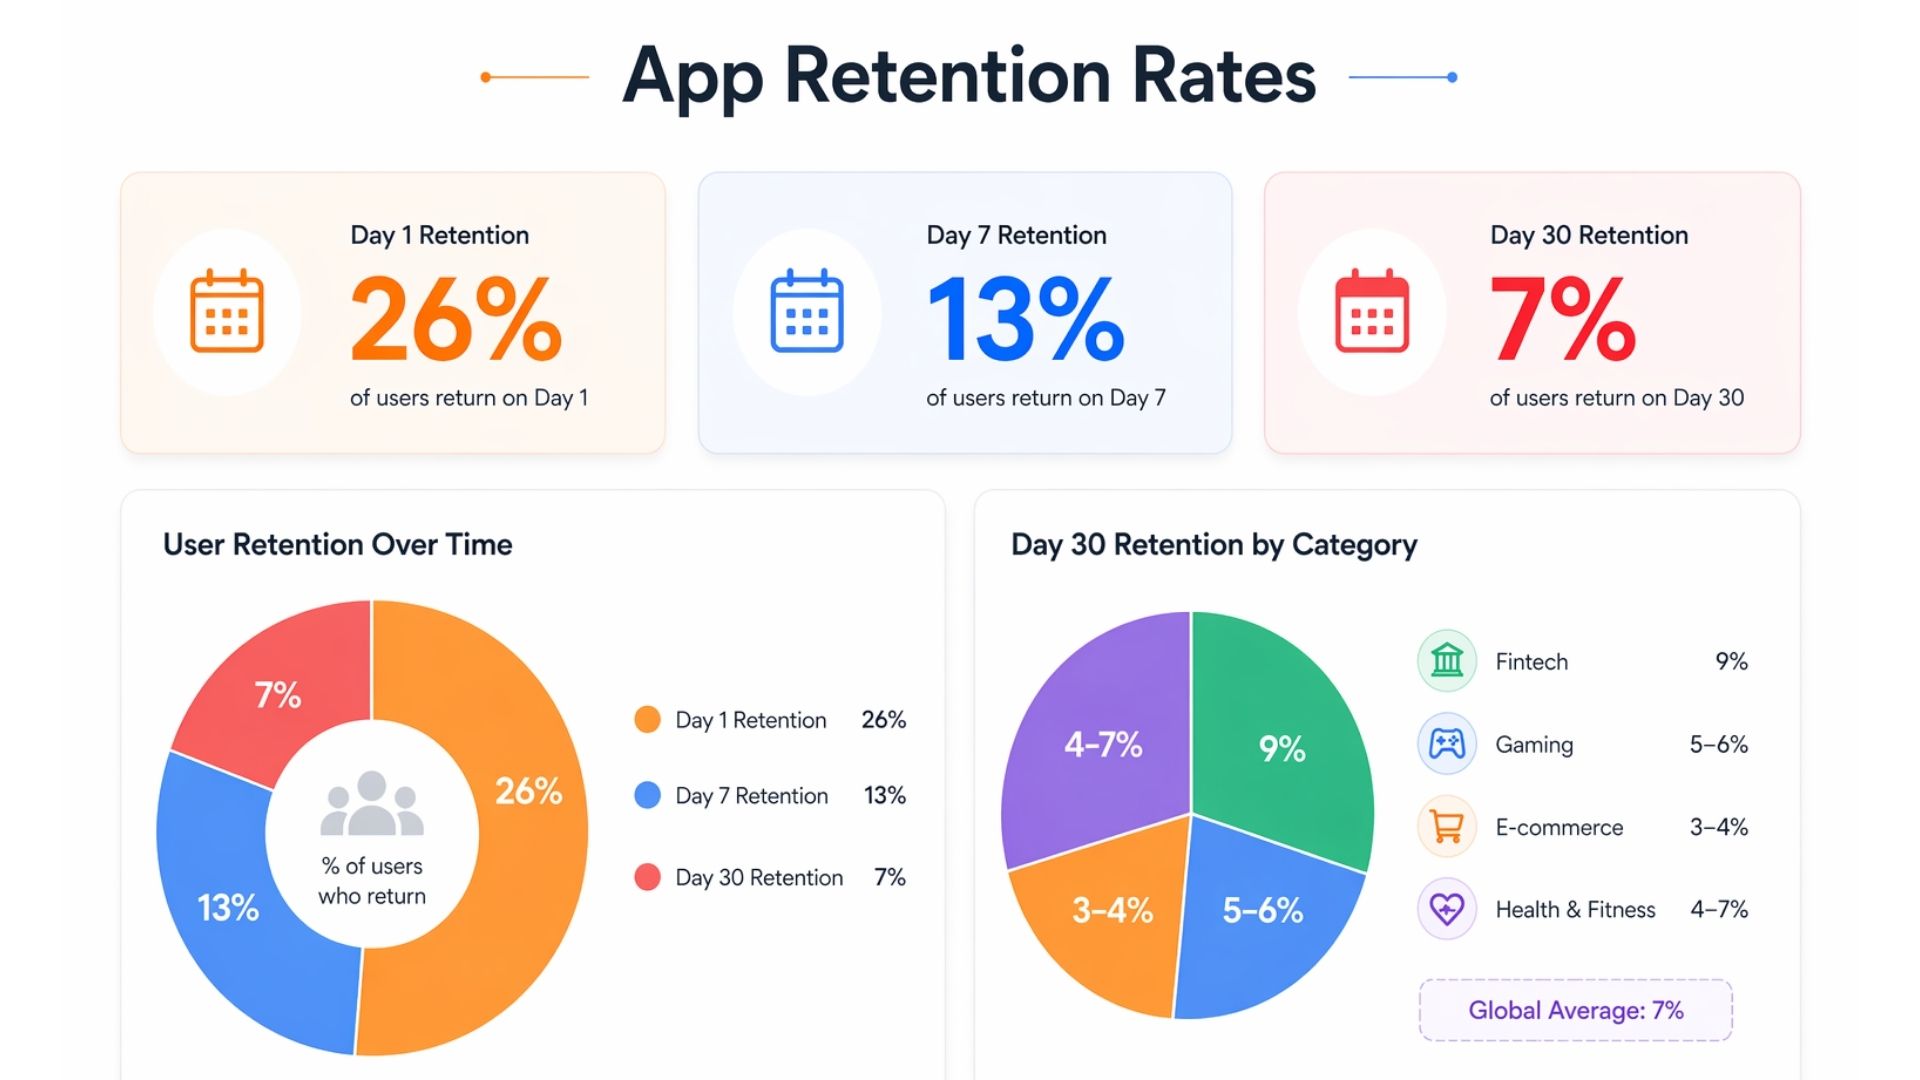
Global average retention falls to 26% on Day 1, 13% by Day 7, and 7% by Day 30 across all app categories and platforms, as per retention benchmark data.
iOS users are consistently stickier, Day 1 at 27% and Day 30 at 8%, while Android shows a steeper decline at Day 1 of 24% and Day 30 of 6%. This divergence reflects both the demographic and behavioral differences between iOS and Android user bases, as well as differences in how each platform surfaces and recommends apps to users.
Retaining a user costs 4 to 5 times less than acquiring a new one. An app is considered high-performing if it retains over a third of its users after installation, a threshold that most consumer apps never reach without deliberate onboarding and habit-formation design built into the product architecture.
Fintech apps lead all verticals in Day 30 retention at 9%, driven by financial stakes and high switching costs that no other category can replicate through product mechanics alone. Marketplace apps within e-commerce consistently deliver 24.8% Day 1 retention, significantly outperforming the global e-commerce average of 13% because product diversity drives repeat purchase behavior. As per Fintech apps lead all verticals in Day 30 retention at 9%.
Day 7 retention is the clearest early indicator of product-market fit. A rate below 10% at Day 7 almost always signals a product architecture problem, not a marketing or distribution problem. Onboarding architecture is the highest-leverage engineering investment for retention outcomes.
Mobile App Development Trends and Technology Statistics
Technology choices now directly influence development speed, scalability, and long-term product performance. This section covers how frameworks, architectures, and development approaches are evolving.
Native vs. Cross-Platform
Cross-platform frameworks have crossed the quality threshold for most consumer and enterprise app use cases. The cross-platform segment is expected to grow at a CAGR of 17.3% through 2034 faster than the overall market per Fortune Business Insights, driven by cost pressure, talent availability, and the narrowing performance gap with native development.
The app development market overall was valued at USD 264.96 billion in 2025 and is estimated to grow to USD 618.65 billion by 2031 at a 15.18% CAGR, with low-code and no-code platforms posting a 29.65% CAGR, indicating rapid adoption across enterprise peripheral tooling.
Flutter vs React Native
According to the survey, Flutter holds 9.4% professional developer usage versus React Native at 9.0%. Among developers learning to code, Flutter leads more substantially at 11.1% versus React Native's 6.7%, indicating that Flutter is winning developer mindshare among the next generation of practitioners.
The decision is primarily a talent and integration call, not a capability gap. A direct comparison of Flutter vs React Native across rendering approach, ecosystem maturity, and team fit shows that for new projects without legacy JavaScript infrastructure, Flutter offers stronger long-term architectural consistency. React Native retains a significant staffing advantage due to the size of the JavaScript talent pool, a practical consideration that often outweighs framework preference in enterprise settings.
Both frameworks together hold over 80% of the cross-platform development market. Teams evaluating which runtime and component model fits their production requirements should assess framework maturity, third-party library ecosystems, and ongoing maintenance overhead alongside initial development speed estimates.
Mobile App Statistics by Industry
Different industries behave very differently on mobile, with varying retention patterns, monetization models, and growth rates. The following breakdown highlights how mobile performance varies across key sectors.
E-Commerce and Retail App Statistics
E-commerce app installs grew 17% year-over-year in 2024, with sessions increasing 13%, per Adjust's Mobile App Trends 2025. While overall installs declined 14% in H1 2025, sessions climbed 2%, indicating a strategic shift toward acquiring higher-quality users rather than raw volume, per Adjust's shopping app trends report.
Shopping apps carry some of the lowest Day 30 retention at roughly 3 to 4%, making the first-purchase experience the single highest-leverage product investment, per shopping app insights. Total global e-commerce revenue is projected to reach USD 3.89 trillion in 2026, reinforcing that mobile commerce is not a channel supplement but the primary purchase surface for an increasing share of global retail volume.
Healthcare and mHealth App Data
The global mHealth apps market is expected to reach USD 86.37 billion by 2030, at a CAGR of 14.9% from 2024 to 2030, Global health and fitness app downloads reached 3.6 billion across iOS and Google Play in 2024, a record high, with sessions up 1% year-over-year in 2025 and installs growing year-over-year across all regions.
Day 30 retention for health and fitness apps ranges from 4 to 7%, making habit formation the central engineering challenge. Products that fail to build streak mechanics, progress tracking, or social accountability into the core experience typically see retention collapse after the initial motivation period, regardless of marketing investment.
Fintech and Finance App Trends
Finance app installs grew 27% year-over-year in 2024, alongside a 24% rise in sessions, the strongest install growth of any major tracked category. Credit and lending apps saw downloads climb 18% year-over-year in 2025, per Finance App Revenue data.
Fintech holds the highest Day 30 retention of any vertical at 9%, driven by financial stakes and high switching costs. The engagement pattern in finance apps reflects a fundamentally different dynamic from consumer lifestyle apps users return because the product holds financial data and history, not because of habit-loop design alone. In Asia, UA spend neared USD 70 billion in 2024, with finance and fintech apps among the fastest-growing categories.
E-Learning and Education App Growth
The global e-learning services market is projected to grow from USD 356.66 billion in 2025 to USD 1,307.62 billion by 2032 at a CAGR of 20.39%. Monthly active users of e-learning apps are projected to surpass 1.2 billion by 2026.
The most successful EdTech products have built streak mechanics, social accountability loops, and adaptive curriculum pacing as retention architecture at the product level, not as post-launch growth features. These mechanics are the primary differentiator between EdTech apps that sustain long-term engagement and those that suffer steep Day 30 drop-off despite strong initial download performance.
Travel and Hospitality App Usage
Travel apps maintain approximately 5% day 30 retention, reflecting the inherently episodic nature of the use case. Retention benchmarks that apply to daily-utility apps are structurally inapplicable to travel products, where session value is concentrated into infrequent but high-intent interactions rather than daily habit loops.
Food delivery application development surged 14% year-over-year in time spent in 2025, As per the industry report, demonstrating that when frequency of use is built into the category itself, retention follows without requiring the same level of behavioral engineering that episodic-use apps must invest in.
Gaming and Entertainment App Statistics
Mobile gaming posted a third consecutive year of revenue growth in 2025, with IAP revenue reaching USD 82.7 billion (+2.2% YoY). The global mobile gaming market was valued at USD 139.38 billion in 2024 and is projected to reach USD 256.19 billion by 2030 at a CAGR of 10.2%.
TikTok was the top-grossing app worldwide with USD 3.3 billion in in-app purchases in 2025, underscoring how social and content platforms now rival mobile games for consumer spending dominance.
APAC emerged as the highest-scoring region with a Growth Score of 45 in Adjust's 2025 Growth Score, combining installs, cost efficiency, sessions per user, and retention. India claimed the global number 1 country-level spot with a growth score of 49, driven by download volume, low acquisition costs, and improving session frequency across categories.
The Top 5 Data Trends Report confirms that Asia's app economy has grown 150% over the past six years, with UA spend nearing USD 70 billion in 2024, a scale that reflects both the volume opportunity and the increasing sophistication of mobile marketing in the region.
A single global monetization model will structurally underperform in at least two regions. Regional pricing, local payment method coverage, and market-specific monetization approaches are launch-phase requirements for any product targeting an international scale, not optimizations to address after initial growth has plateaued.
Mobile App Development Cost and Time Statistics
Building a mobile app involves more than just the initial development cost. Time, maintenance, and long-term scaling requirements all impact total investment, and these benchmarks help set realistic expectations.
A basic native iOS or Android app costs USD 20,000 to 50,000 with a development time of 3 to 6 months. This range assumes a defined scope, a single platform, and a relatively standard feature set without complex backend integrations or third-party API dependencies.
A mid-complexity cross-platform app using Flutter or React Native ranges from USD 30,000 to 80,000, typically requiring 4 to 8 months of development.
Enterprise mobile applications development with complex backends and multiple integrations can exceed USD 500,000 and require 12+ months.
Post-launch maintenance typically requires 15 to 20% of initial development cost annually for OS compatibility, updates, and bug fixes. This is a consistent cost floor across app categories and complexity tiers and one that most initial project budgets fail to account for adequately.
Cross-platform frameworks like Flutter and React Native can reduce development time by up to 40 to 50% versus building separate native iOS and Android apps. The app development market is valued at USD 195.77 billion in projected 2025 revenue for application development software globally, reflecting the scale of the overall software ecosystem that mobile development sits within.
The total cost of mobile app ownership is rarely calculated correctly. Most teams budget for the build but underestimate ongoing maintenance, performance monitoring, and adaptation to OS updates, which collectively represent 50 to 70% of the five-year total cost of a production mobile application.
Future Trends in Mobile App Development
The mobile ecosystem is evolving toward more intelligent, real-time, and performance-driven experiences. The trends below highlight where the industry is heading and what teams need to prepare for.
AI as Infrastructure
AI app revenue grew. 254% year-over-year in 2025. AI is moving from an app-level feature to an engineering infrastructure layer. On-device inference, real-time contextual personalization, and AI-assisted development tooling are becoming standard engineering requirements.
Teams that treat AI as an optional enhancement rather than a foundational architecture decision will face compounding product disadvantages as user expectations reset to AI-native interaction patterns.
The Performance Index analyzing 16.2 billion installs from 39,000 apps confirms that AI-driven creative innovation has already become a standard feature of high-performing user acquisition, with the average app producing 839 creative variations. The same AI infrastructure shift is now entering product and retention engineering.
Monetization-First Architecture
Downloads are flat, time spent is saturating, and acquisition costs are rising. Six consecutive quarters of at least 10% year-over-year IAP revenue growth confirm that the winners are those who master monetization depth and retention, not volume.
Subscription optimization, paywall architecture, and price localization are moving from growth team responsibilities to core product engineering concerns requiring collaboration between engineering, product, and finance at the architecture stage.
5G Enabling Real-Time Experiences
According to the industry report, global smartphone subscriptions continue to grow, with 5G becoming the dominant mobile technology globally by the end of the decade.
5G now covers 55% of the global population and accounts for more than one third of all mobile broadband subscriptions. 5G enables low-latency use cases, real-time AR navigation, cloud gaming, and live collaboration that were technically impractical on 4G infrastructure.
Performance Engineering as a Ranking Signal
Low stability scores are a structural predictor of low app store ratings, with the median crash-free session rate at 99.95% cementing itself as the minimum viable bar.
App store algorithms explicitly factor crash-free session rates and load times into organic ranking signals. Teams that treat performance engineering as a continuous practice built into CI/CD for mobile rather than addressed reactively after a rating drop will compound a discoverability advantage that is difficult for lower-discipline competitors to close.
Spatial Computing and AR Integration
Sports betting apps saw time spent increase 7% year-over-year in 2025, partly via AR-layer enhancements, and food delivery apps surged 14% year-over-year. The convergence of mobile and spatial computing is generating new engagement surfaces within standard app categories, not just standalone AR products.
AR integration is increasingly a retention engineering tool within mainstream consumer categories, not a novelty feature reserved for specialized applications.
Key Takeaways for Businesses
- Revenue has decoupled from downloads. Downloads grew 0.8% in 2025, IAP revenue grew 10.6%. The market rewards monetization depth, not acquisition volume.
- The market is growing toward USD 626 billion by 2030. Entry is accessible; differentiation requires engineering quality and retention performance.
- Retention is an engineering outcome, not a marketing one. Day 7 retention below 10% signals a product problem, onboarding and time-to-value design must be built in, not patched through re-engagement campaigns.
- Stability is an acquisition variable. The 99.95% crash-free session threshold is the current industry median. Falling below it suppresses app store ranking algorithmically, compounding paid acquisition costs.
- iOS and Android serve different strategic objectives. Subscription products targeting Western markets should prioritize iOS. Volume-based, ad-funded models targeting APAC require broad Android investment across a fragmented device landscape.
- AI integration is now the baseline expectation. AI app revenue grew 254% year-over-year in 2025. User expectations for personalization and intelligent interfaces are rising faster than most product roadmaps are currently addressing.
- Localization is a revenue function. 80% of app spending occurs outside the country where an app was developed. Regional pricing and payment method coverage are launch-phase requirements, not growth-phase ones.
- Performance engineering compounds over time. Every improvement in crash-free session rate translates to better organic ranking, lower CAC, and higher LTV, making stability engineering one of the highest-ROI investments available to a mobile product team.
 WhatsApp
 Call Us
 Mail Us